Visualizing request states in Kibana
| 🌐 This document is available in both English and Ukrainian. Use the language toggle in the top right corner to switch between versions. |
1. Dashboard overview
The Request state dashboard provides an overview of the registry’s operations, including the status of external requests and an analysis of encountered errors. It enables quick assessment of the system’s overall health, identification of potential issues, and detailed analysis of API requests, the use of qualified electronic signatures (QES), and errors in various registry components.
The dashboard includes visualizations for monitoring microservice requests, tracking errors in the REST API, evaluating API gateway performance, and tools for dynamically filtering data by microservice. With its user-friendly visual representation, users can promptly identify issues and take the necessary corrective actions.
| Visualization name | Description | ||
|---|---|---|---|
Requests to registry microservices |
Displays the total number of requests to registry microservices, categorized by HTTP response codes and containers. |
||
Requests to API gateway |
Shows the total number of external HTTP requests received by the registry, categorized by response statuses. |
||
QES usage in the registry |
Displays the total number of operations using qualified electronic signatures (QES) performed on the cryptoservice, categorized by type and execution status. |
||
Errors in data factory REST API |
Shows the number of errors encountered during requests to the data factory REST API, broken down by exception types. |
||
Calls from Trembita (Secure Exchange Gateway) |
Displays requests routed through the Trembita integration platform, categorized by response codes.
|
||
Unexpected EOF on client connection |
Visualizes the number of errors due to unexpected connection failures with the database. |
||
Analytical DB replication errors |
Shows errors in the replication of the analytical database. |
||
Microservices filter |
Allows users to filter data by container name for easier analysis of specific microservices. |
- Sample visualizations are shown in the screenshots below:
-
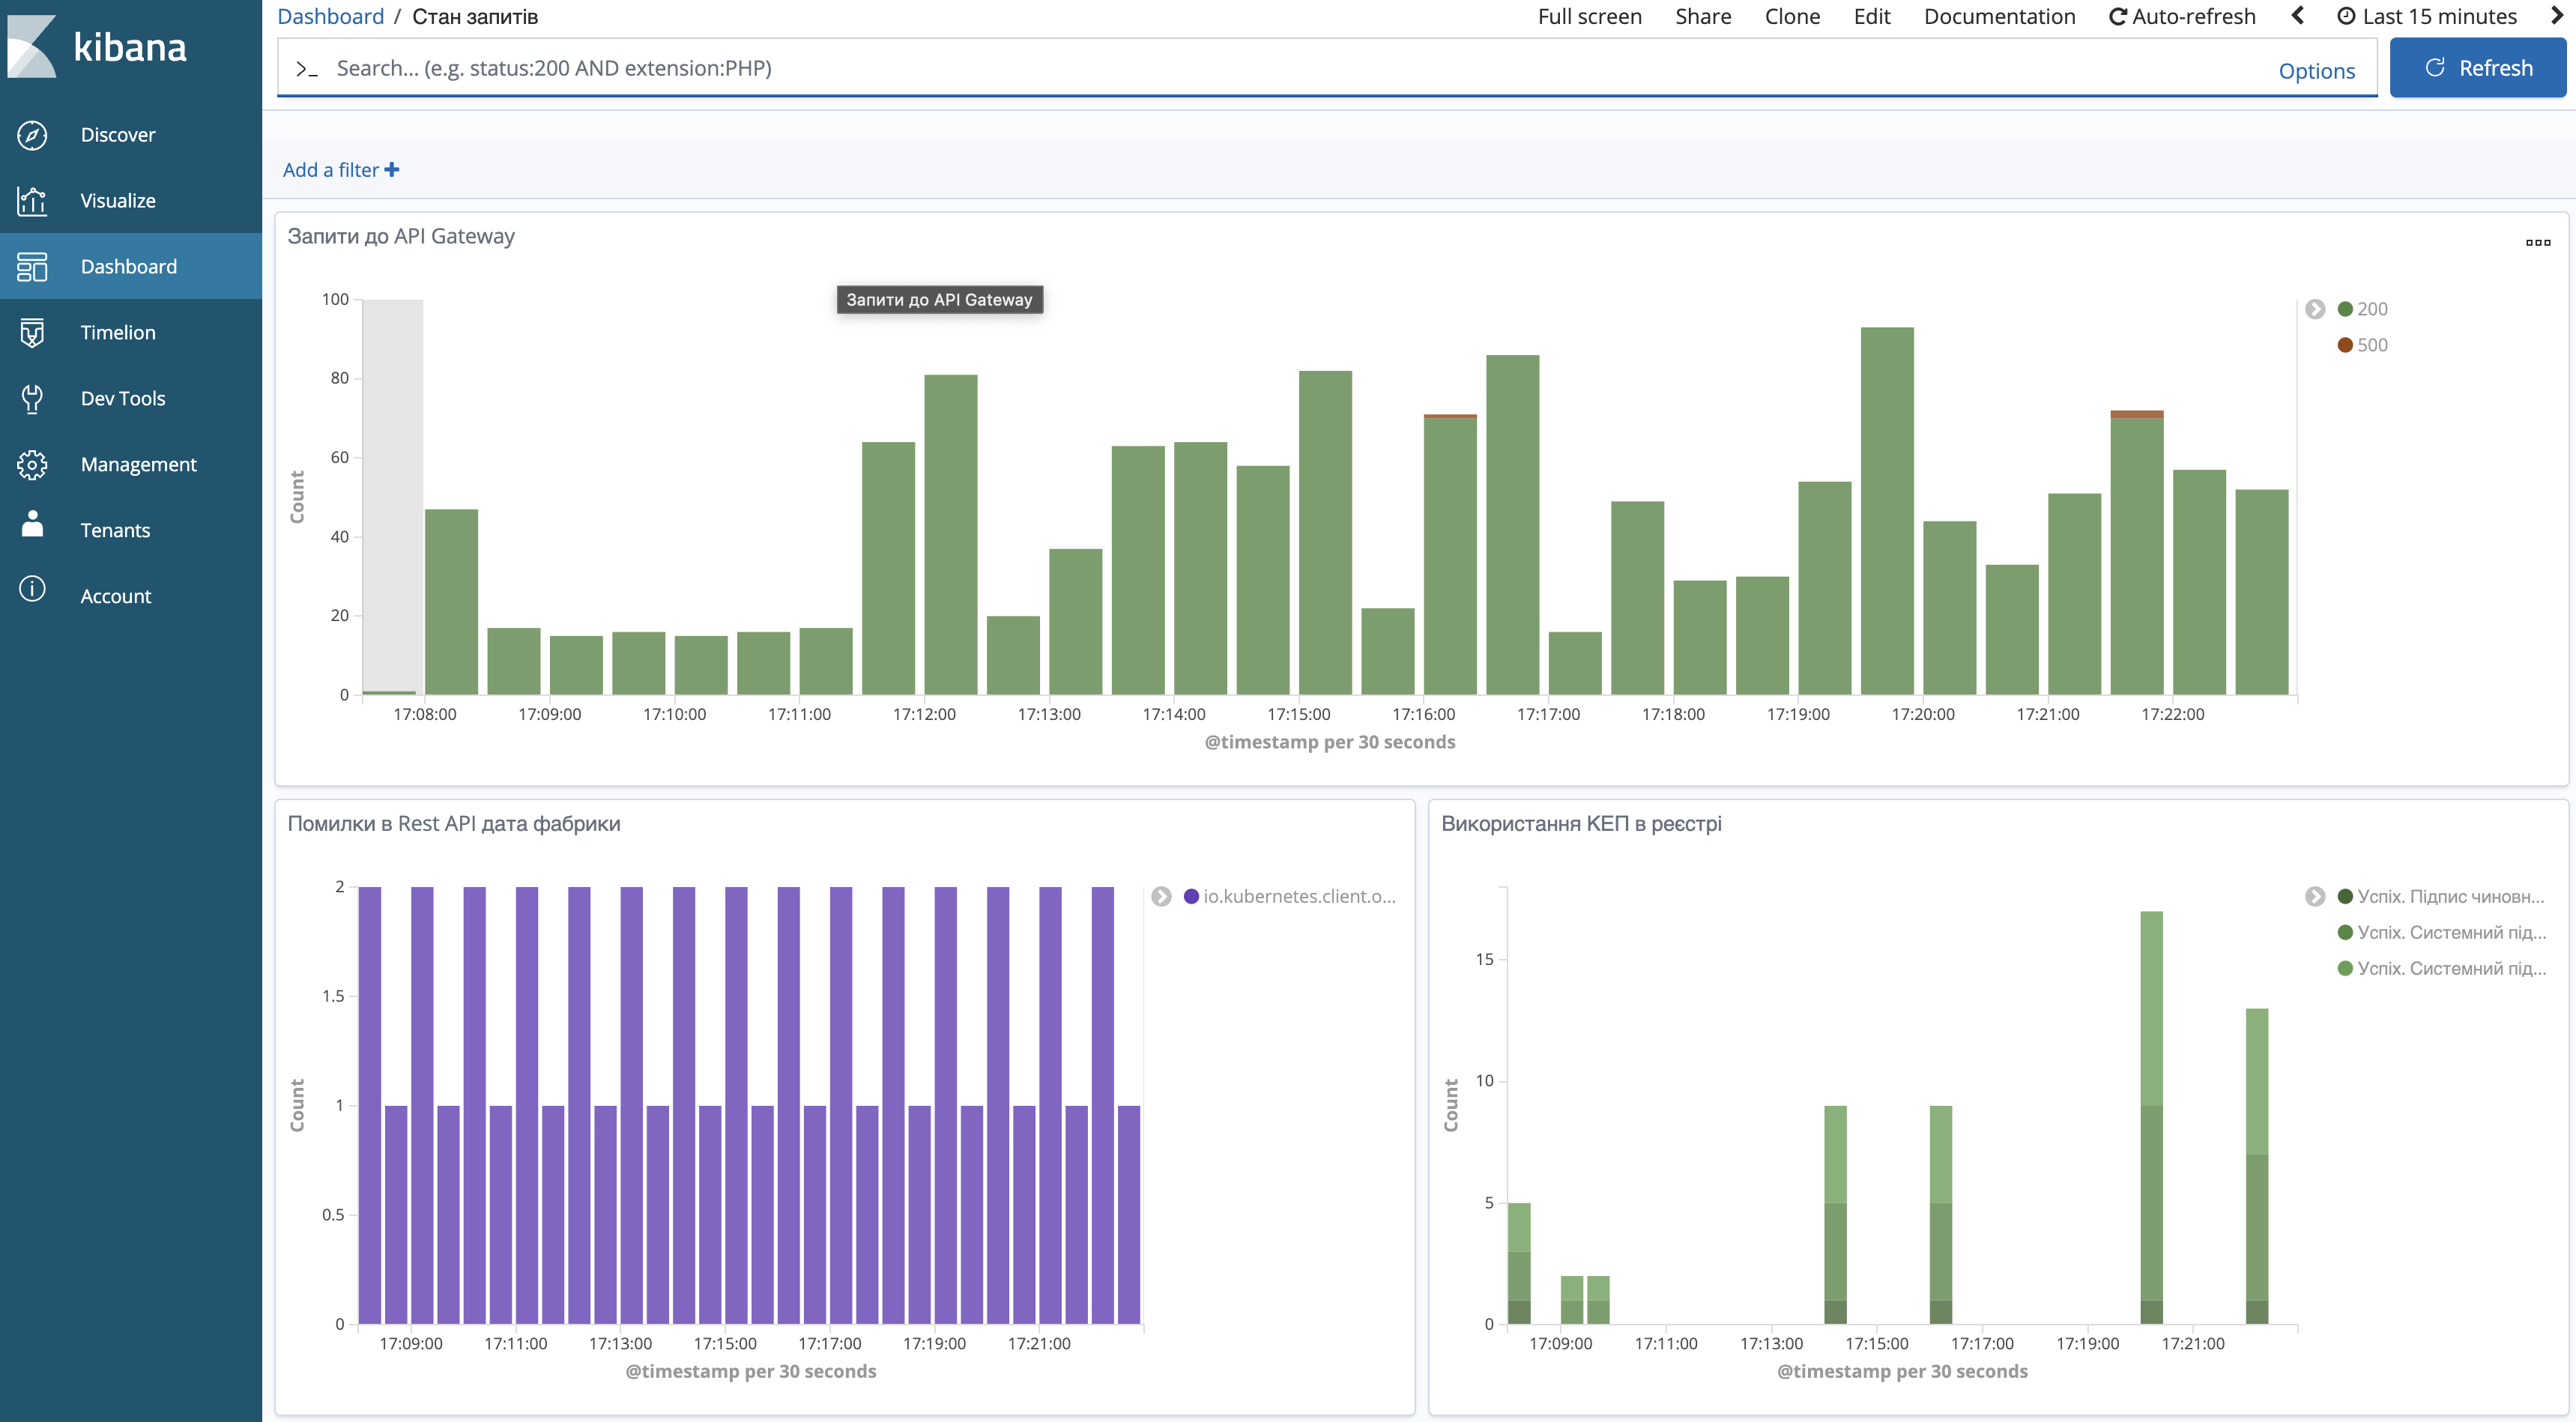
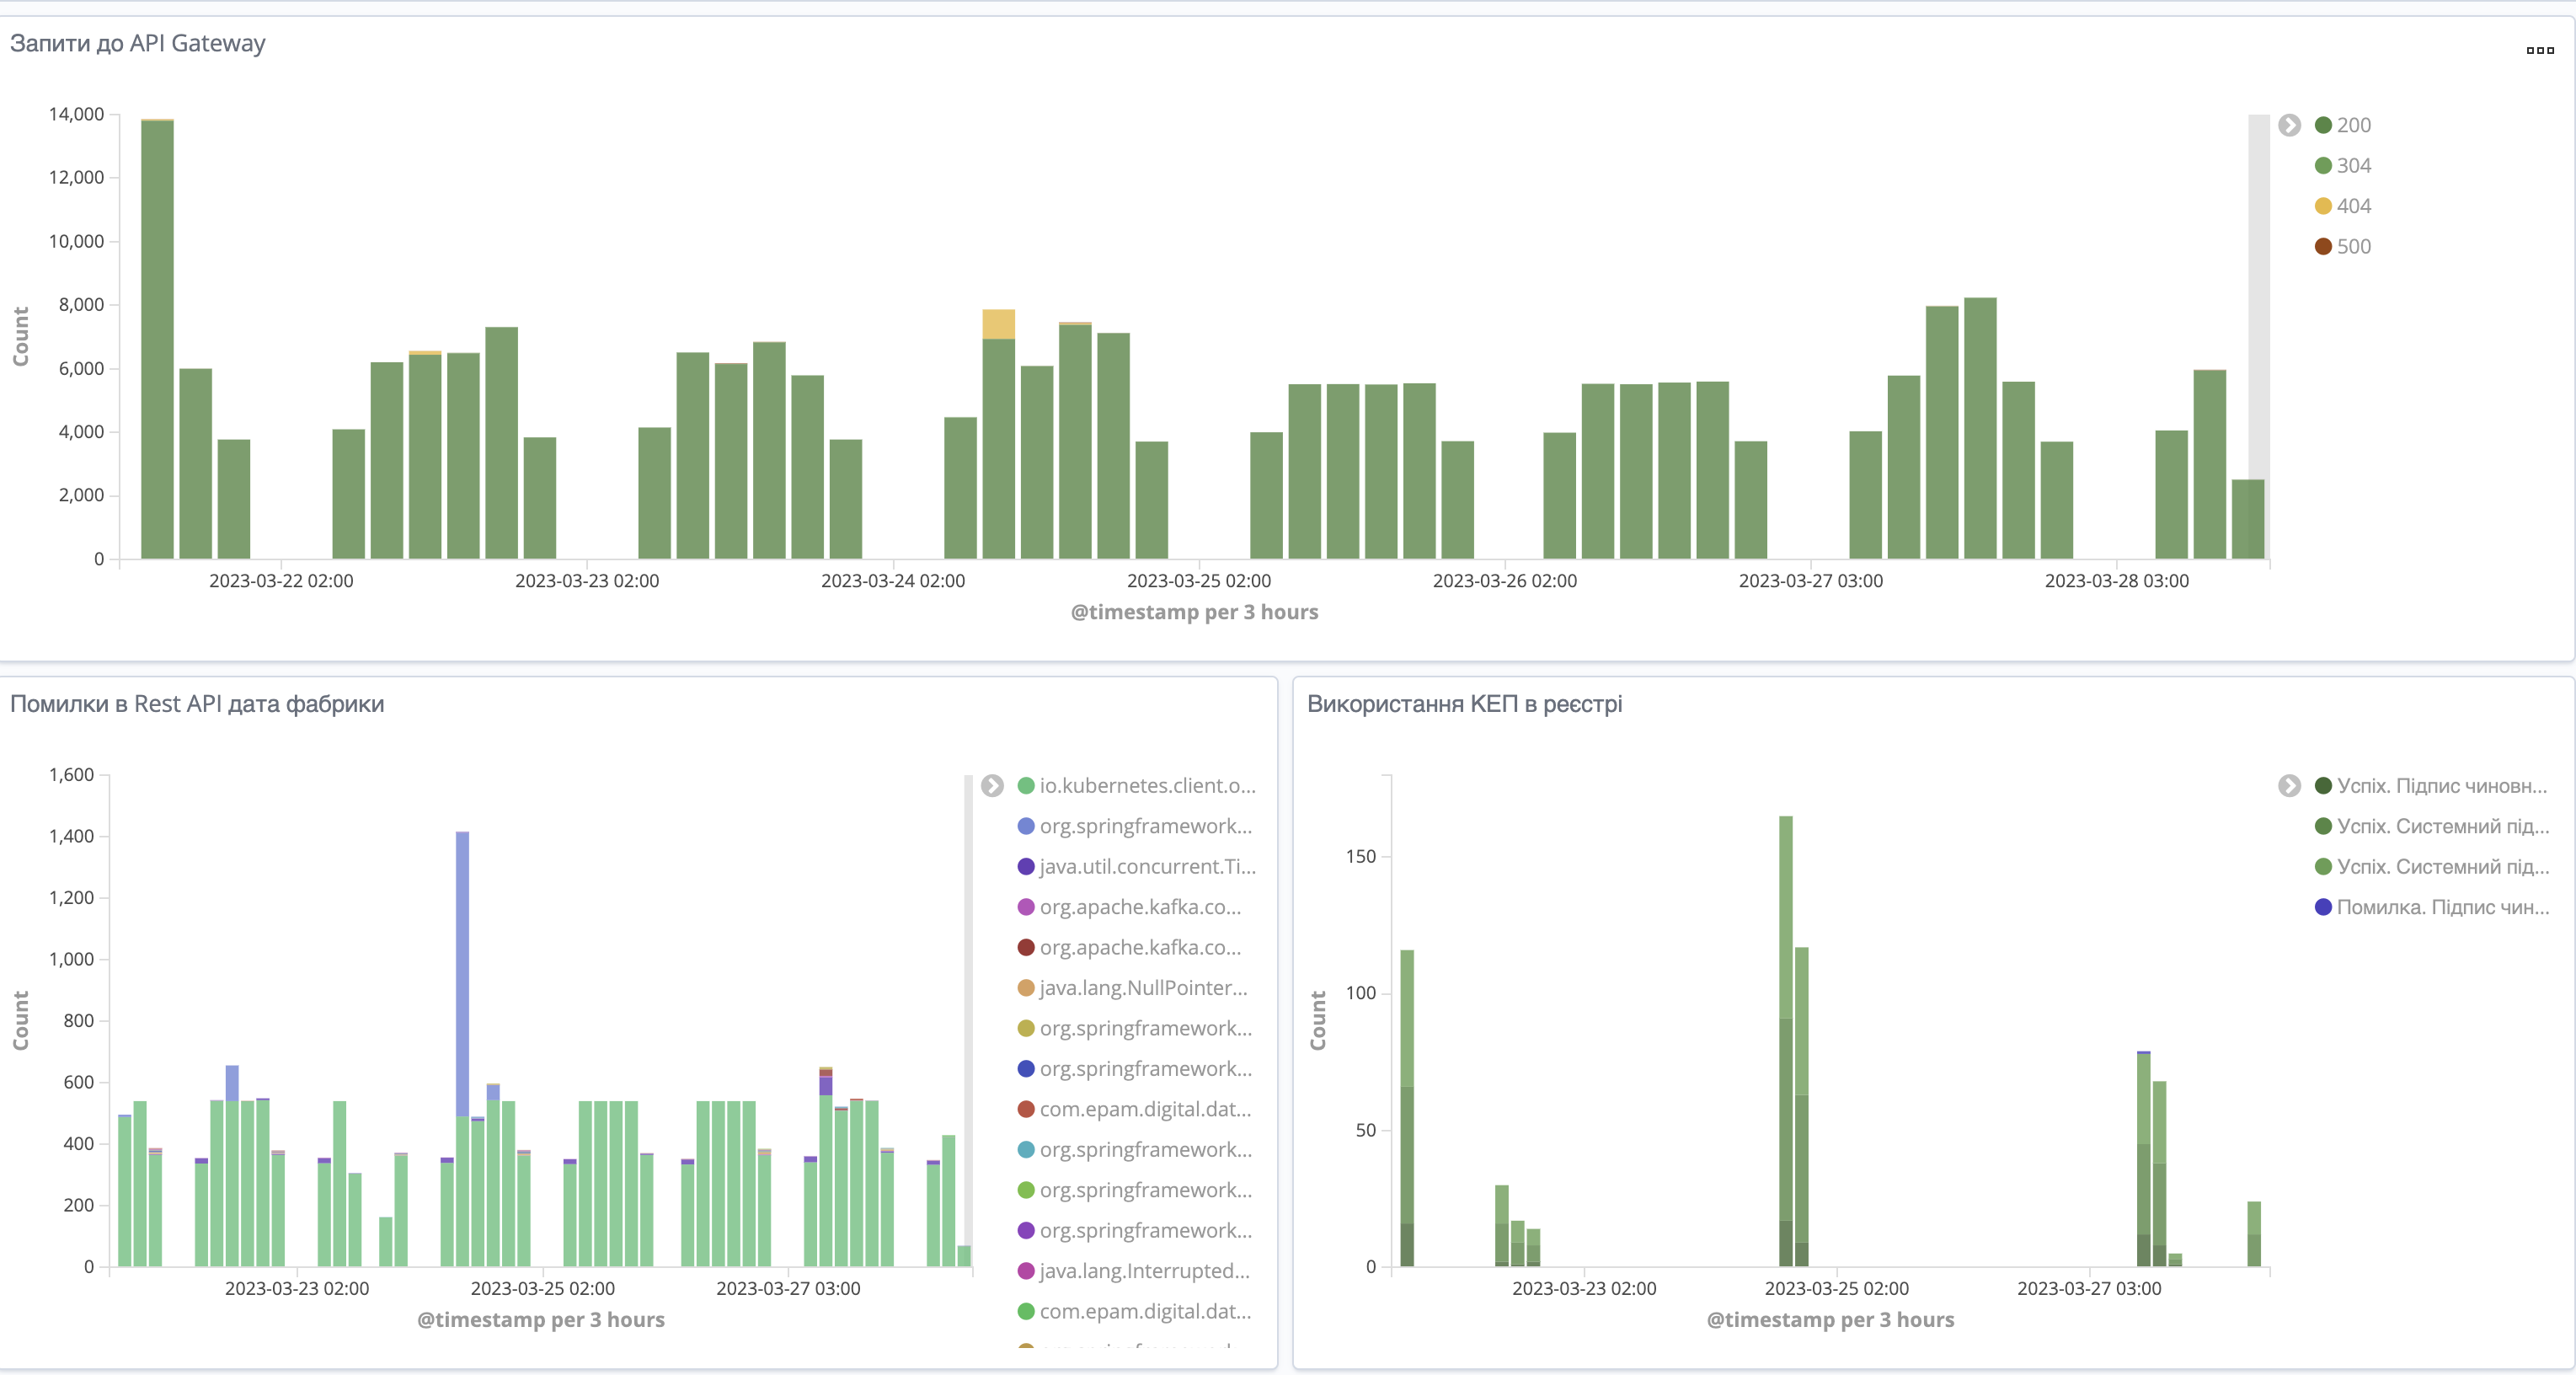 Figure 1. Requests to API gateway, errors in data factory REST API, and QES usage in the registry
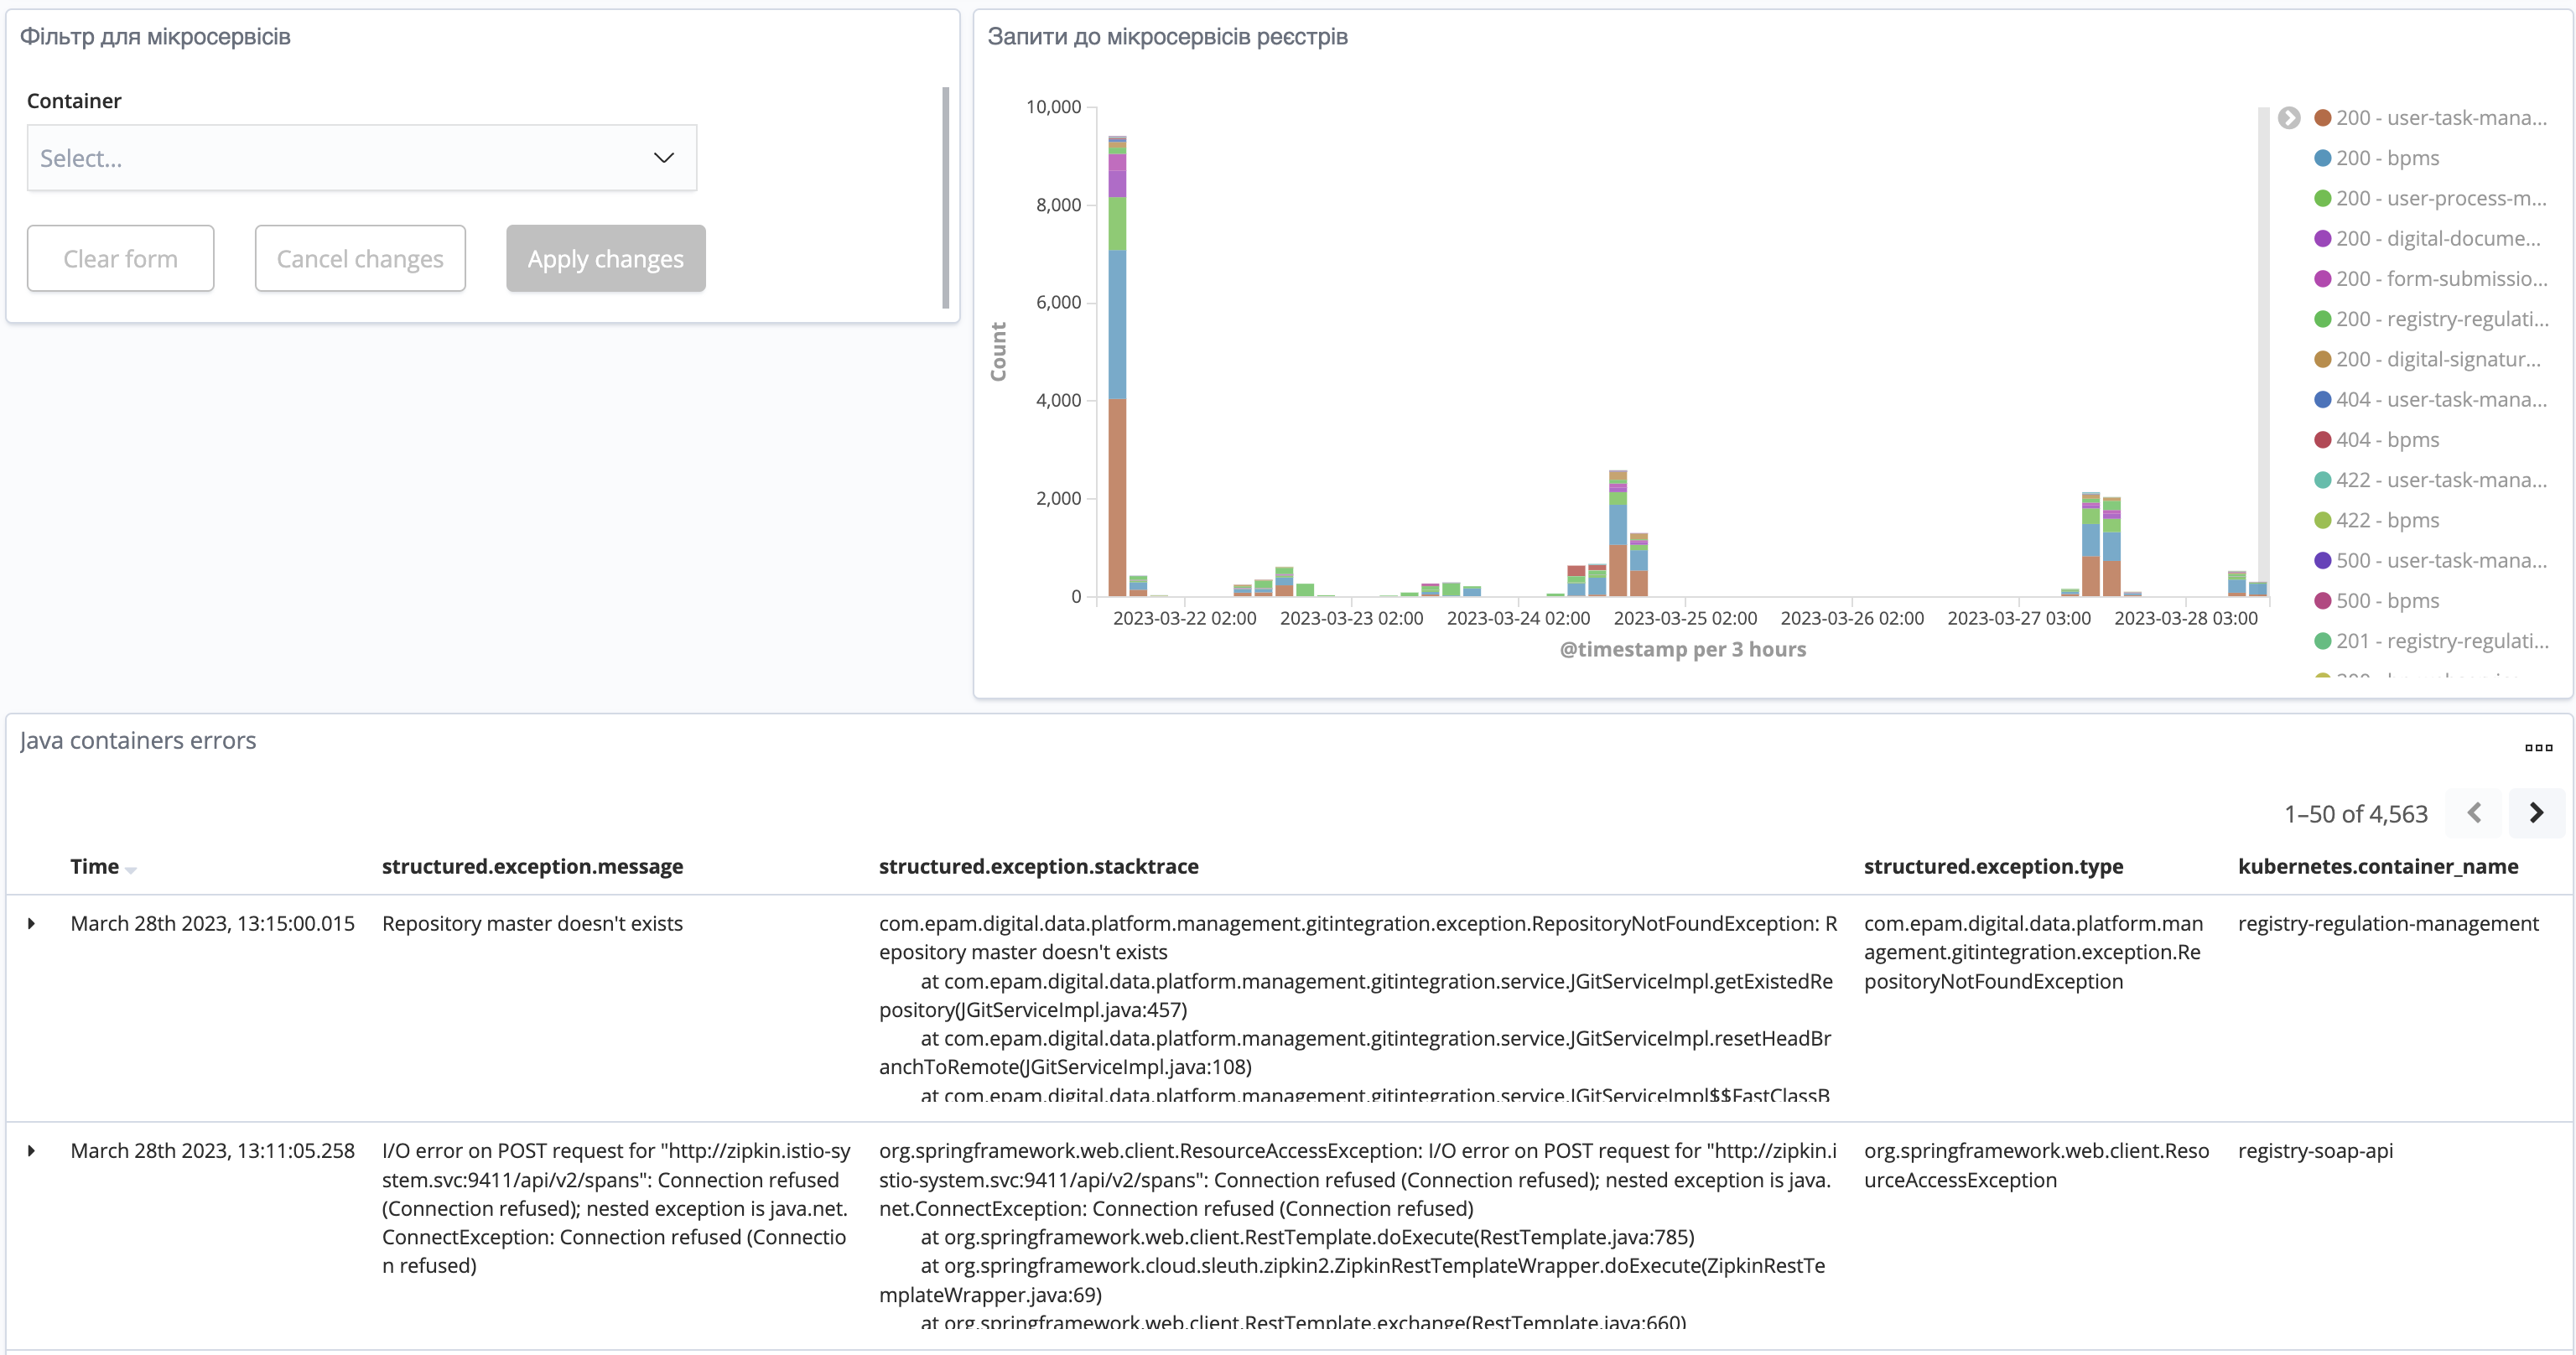 Figure 2. Requests to microservices
2. Dashboard setup instructions
To install this dashboard, follow these steps:
-
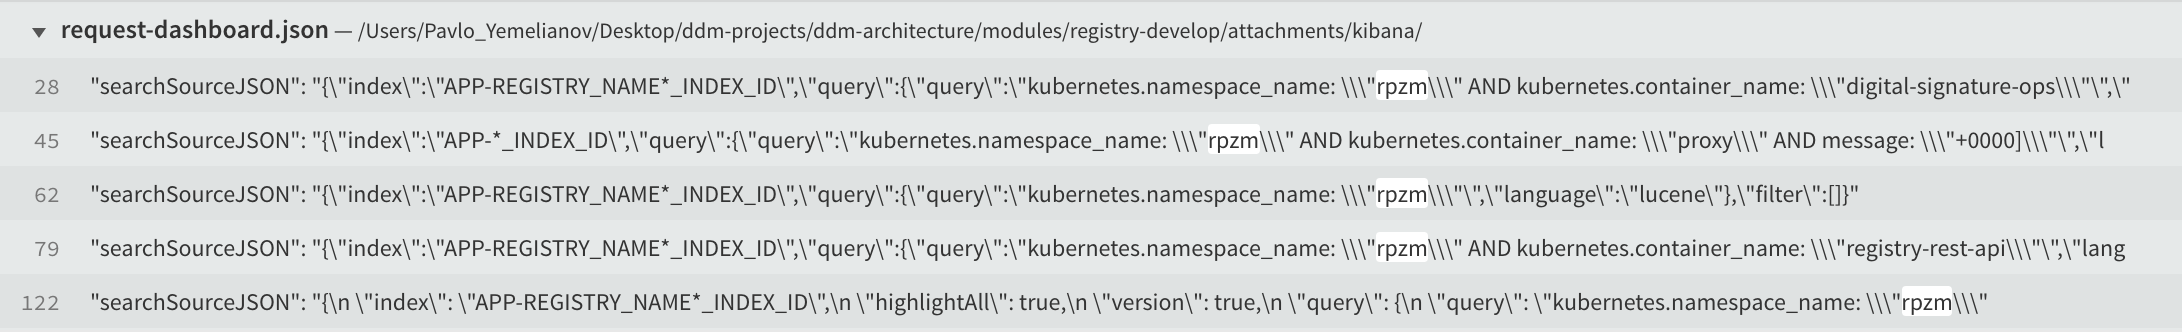
Download the request-dashboard.json file.
-
Replace all
YOUR_REGISTRY_NAMEplaceholders in the file with the desired registry name in search queries using your preferred text editor. There are currently 8 placeholders.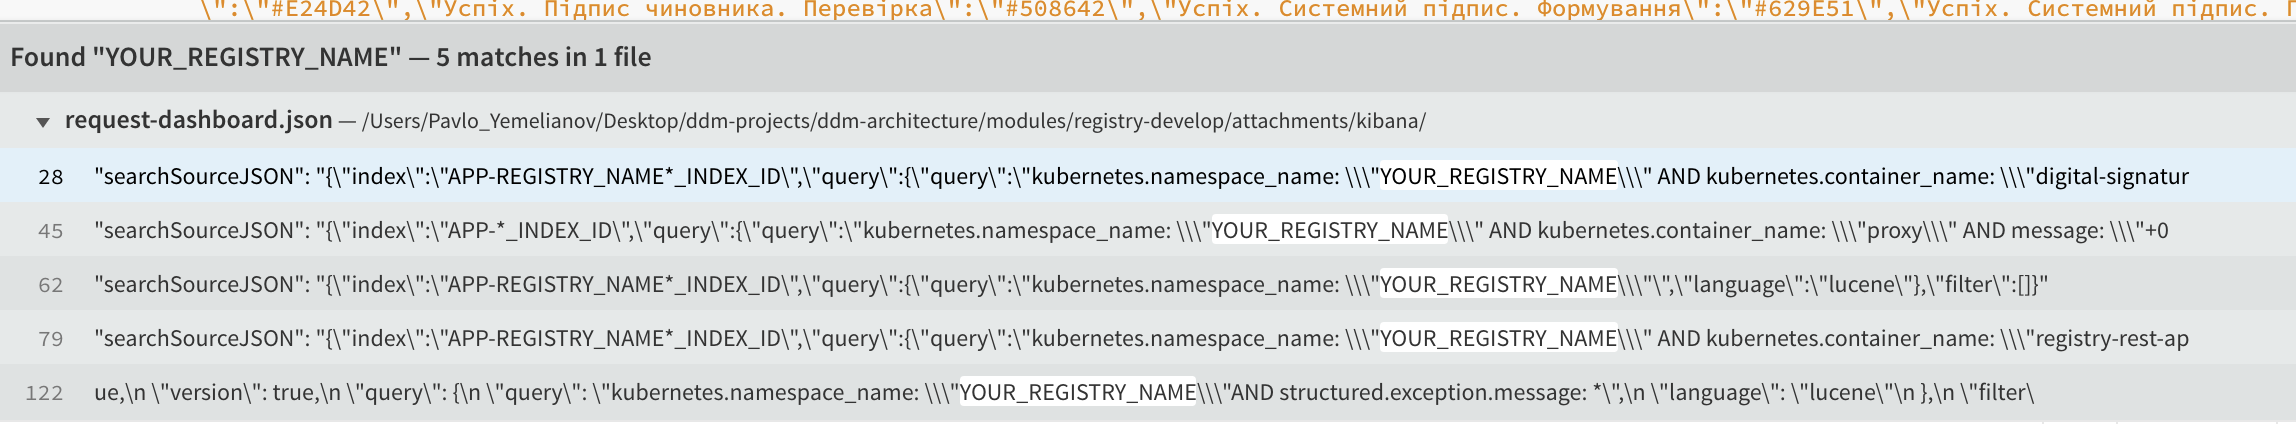

-
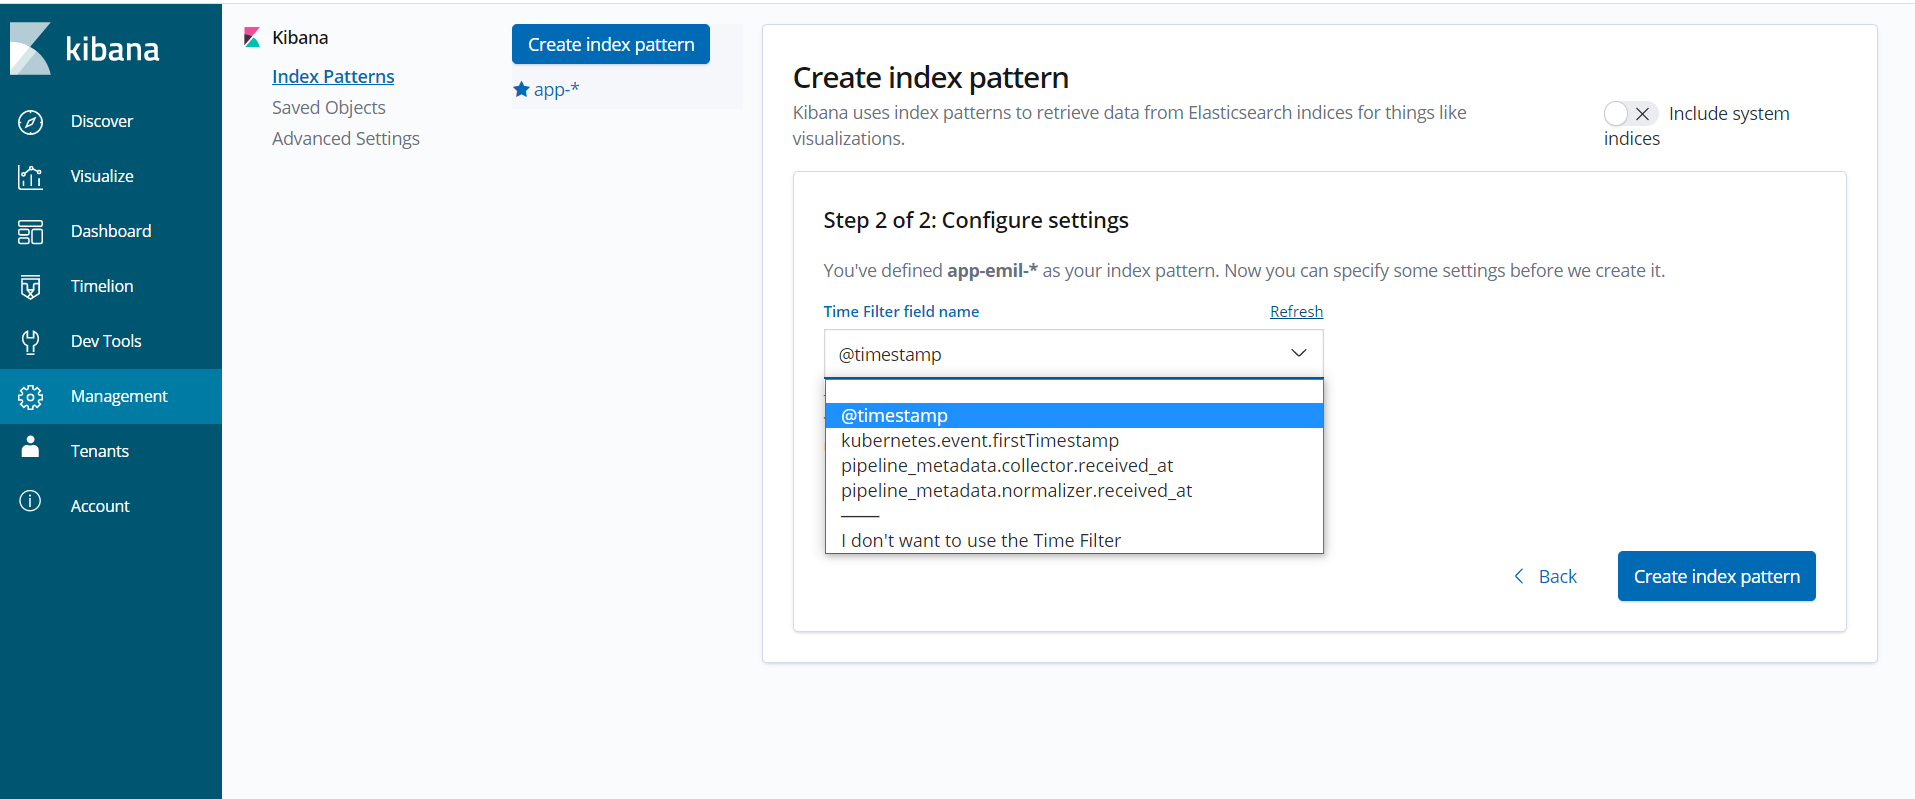
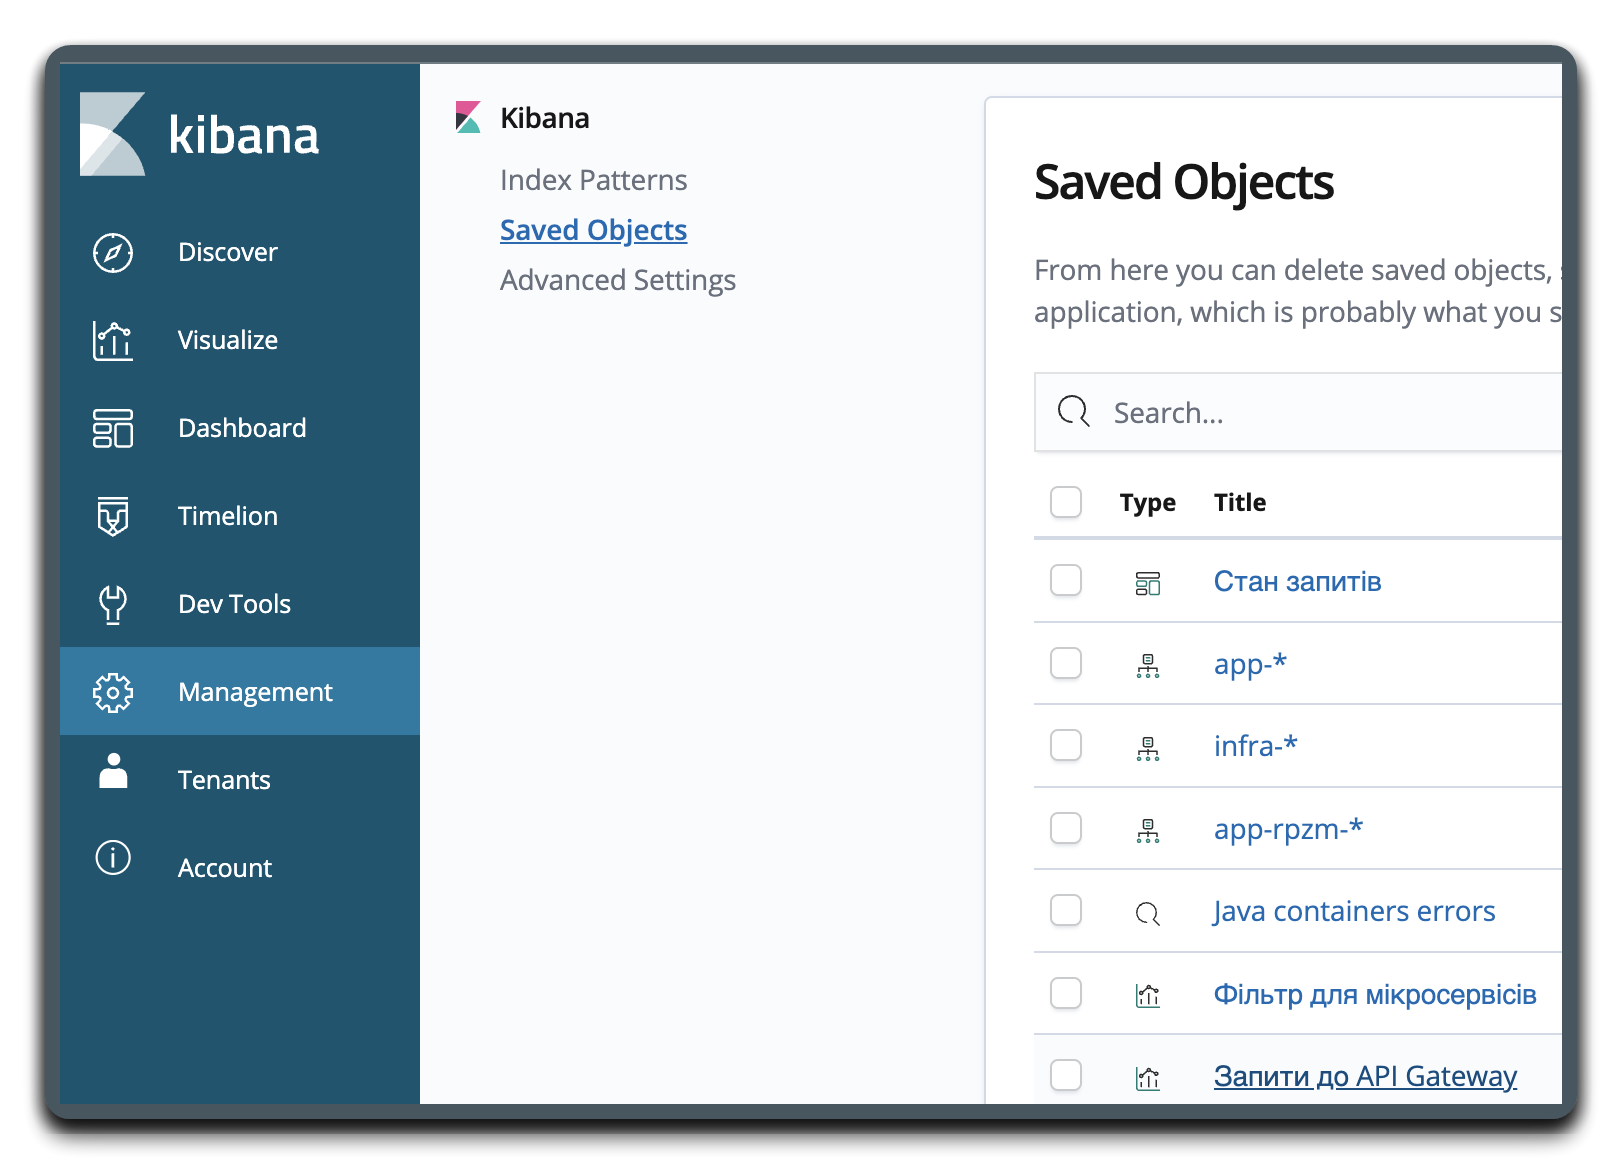
Create 2 index patterns in the Kibana web interface:
app-and *app-<REGISTRY-NAME>-*.<REGISTRY-NAME>refers to your registry name, e.g.,app-test-registry-*.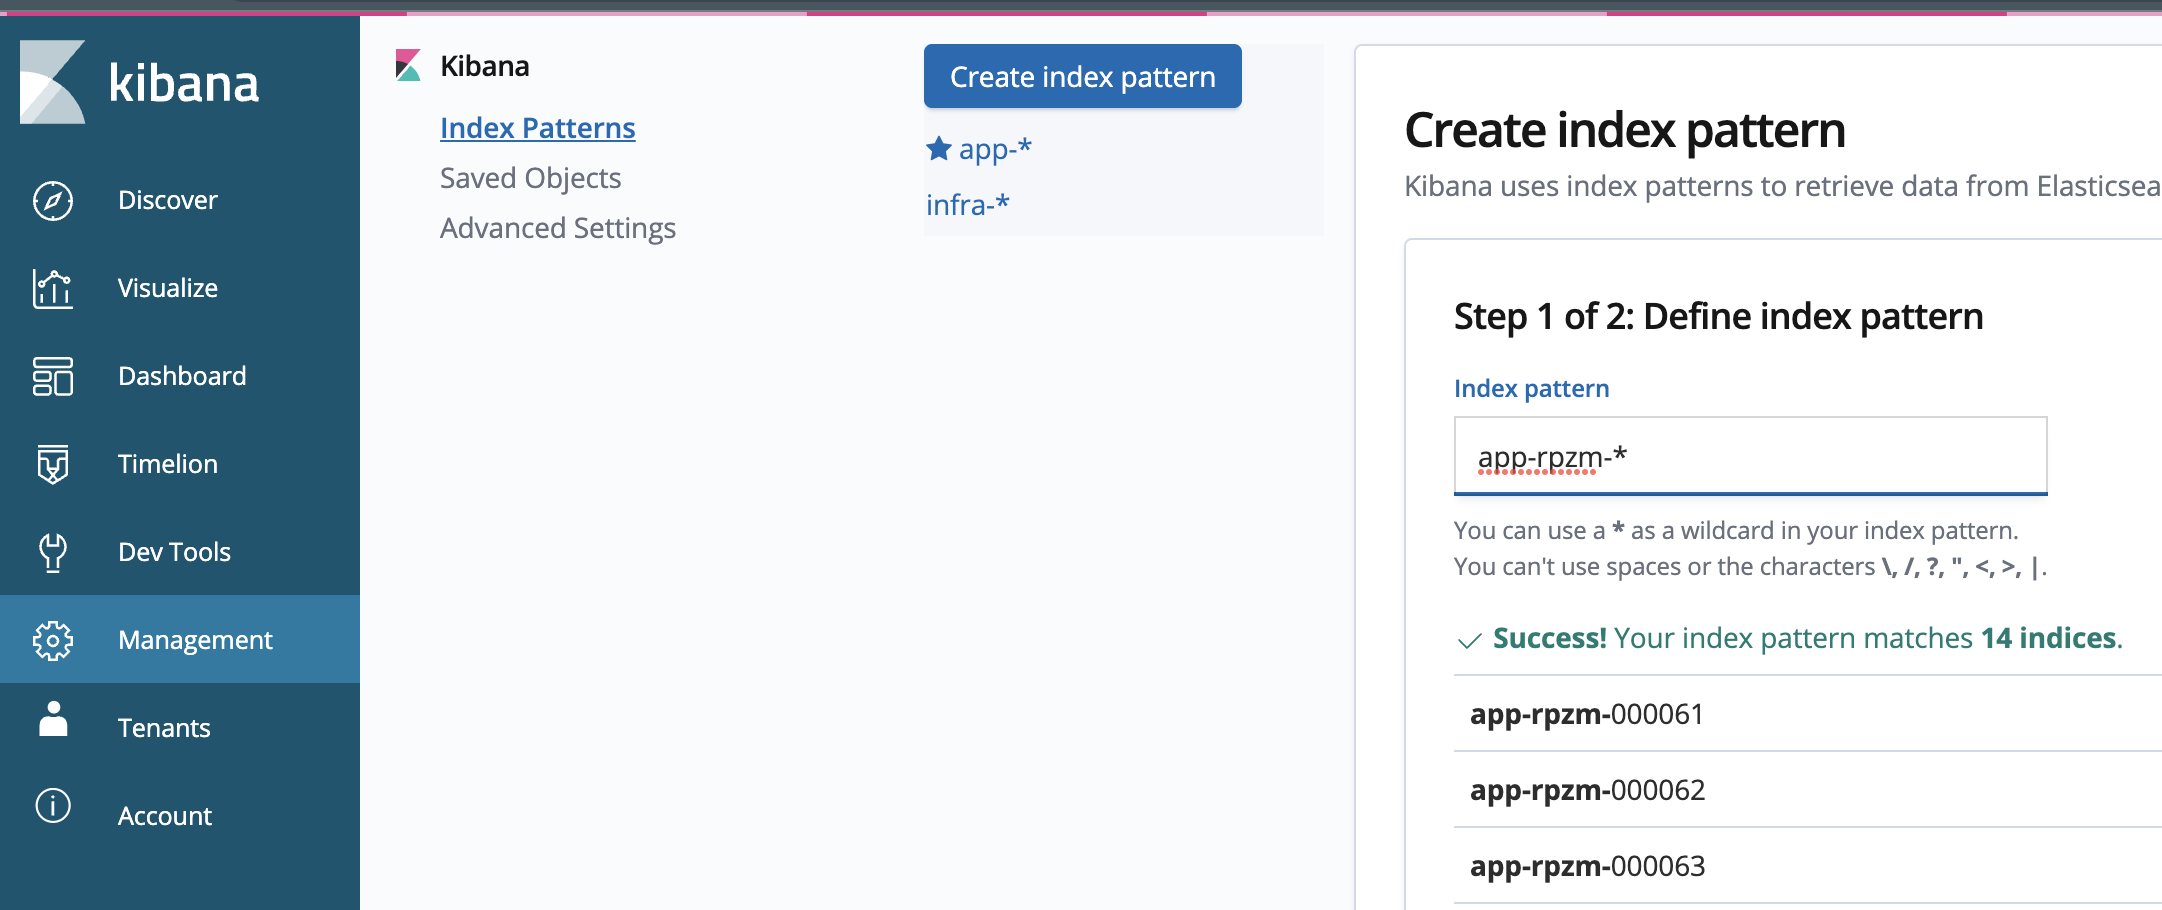
-
Import the prepared file from step 2 via the Kibana web interface.
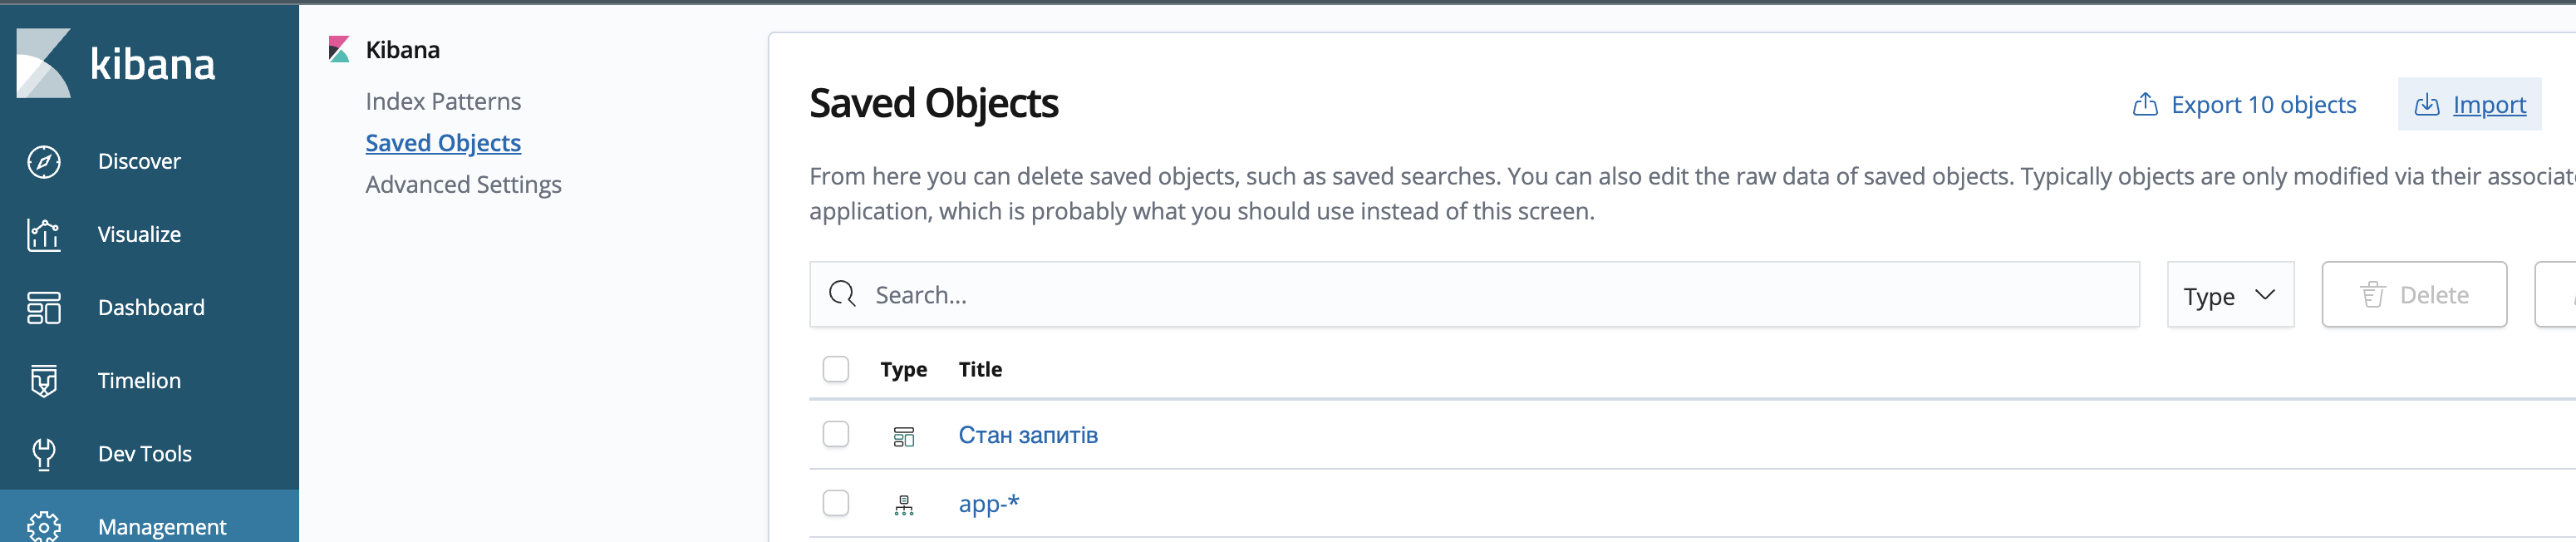
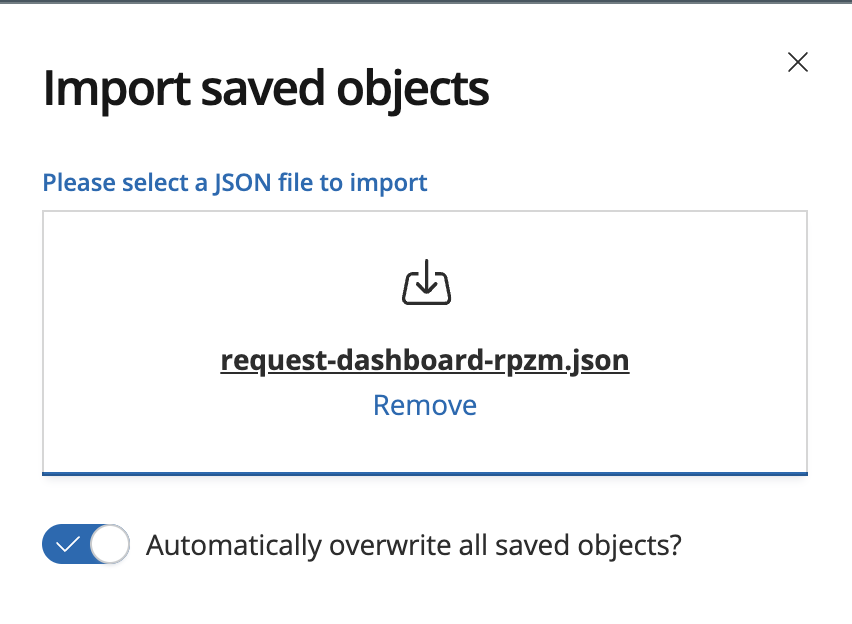
During the import, select the appropriate index pattern for the visualizations (
app-REGISTRY-NAME-*).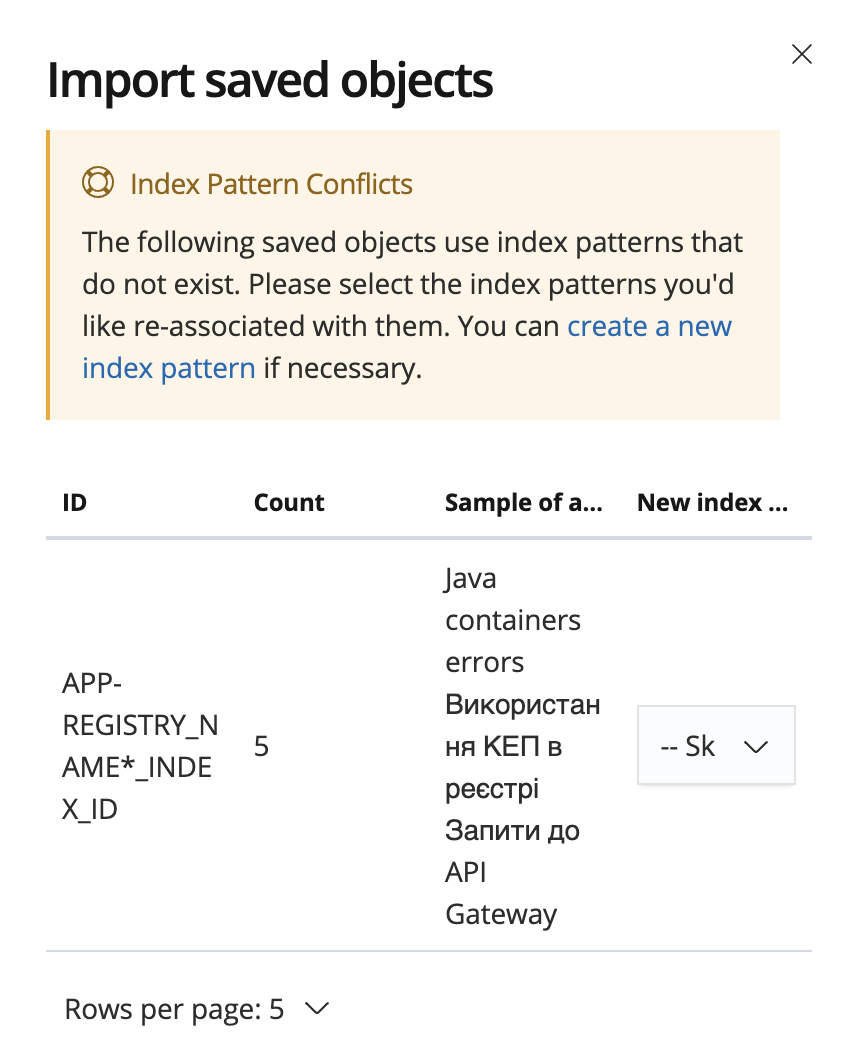
-
Configure the dynamic filter.
To ensure the Microservices filter works correctly, update the
indexPatternID as follows:-
Open the Requests to API gateway visualization.
-
Copy the value of the
indexparameter from thekibanaSavedObjectMeta.searchSourceJSONsection.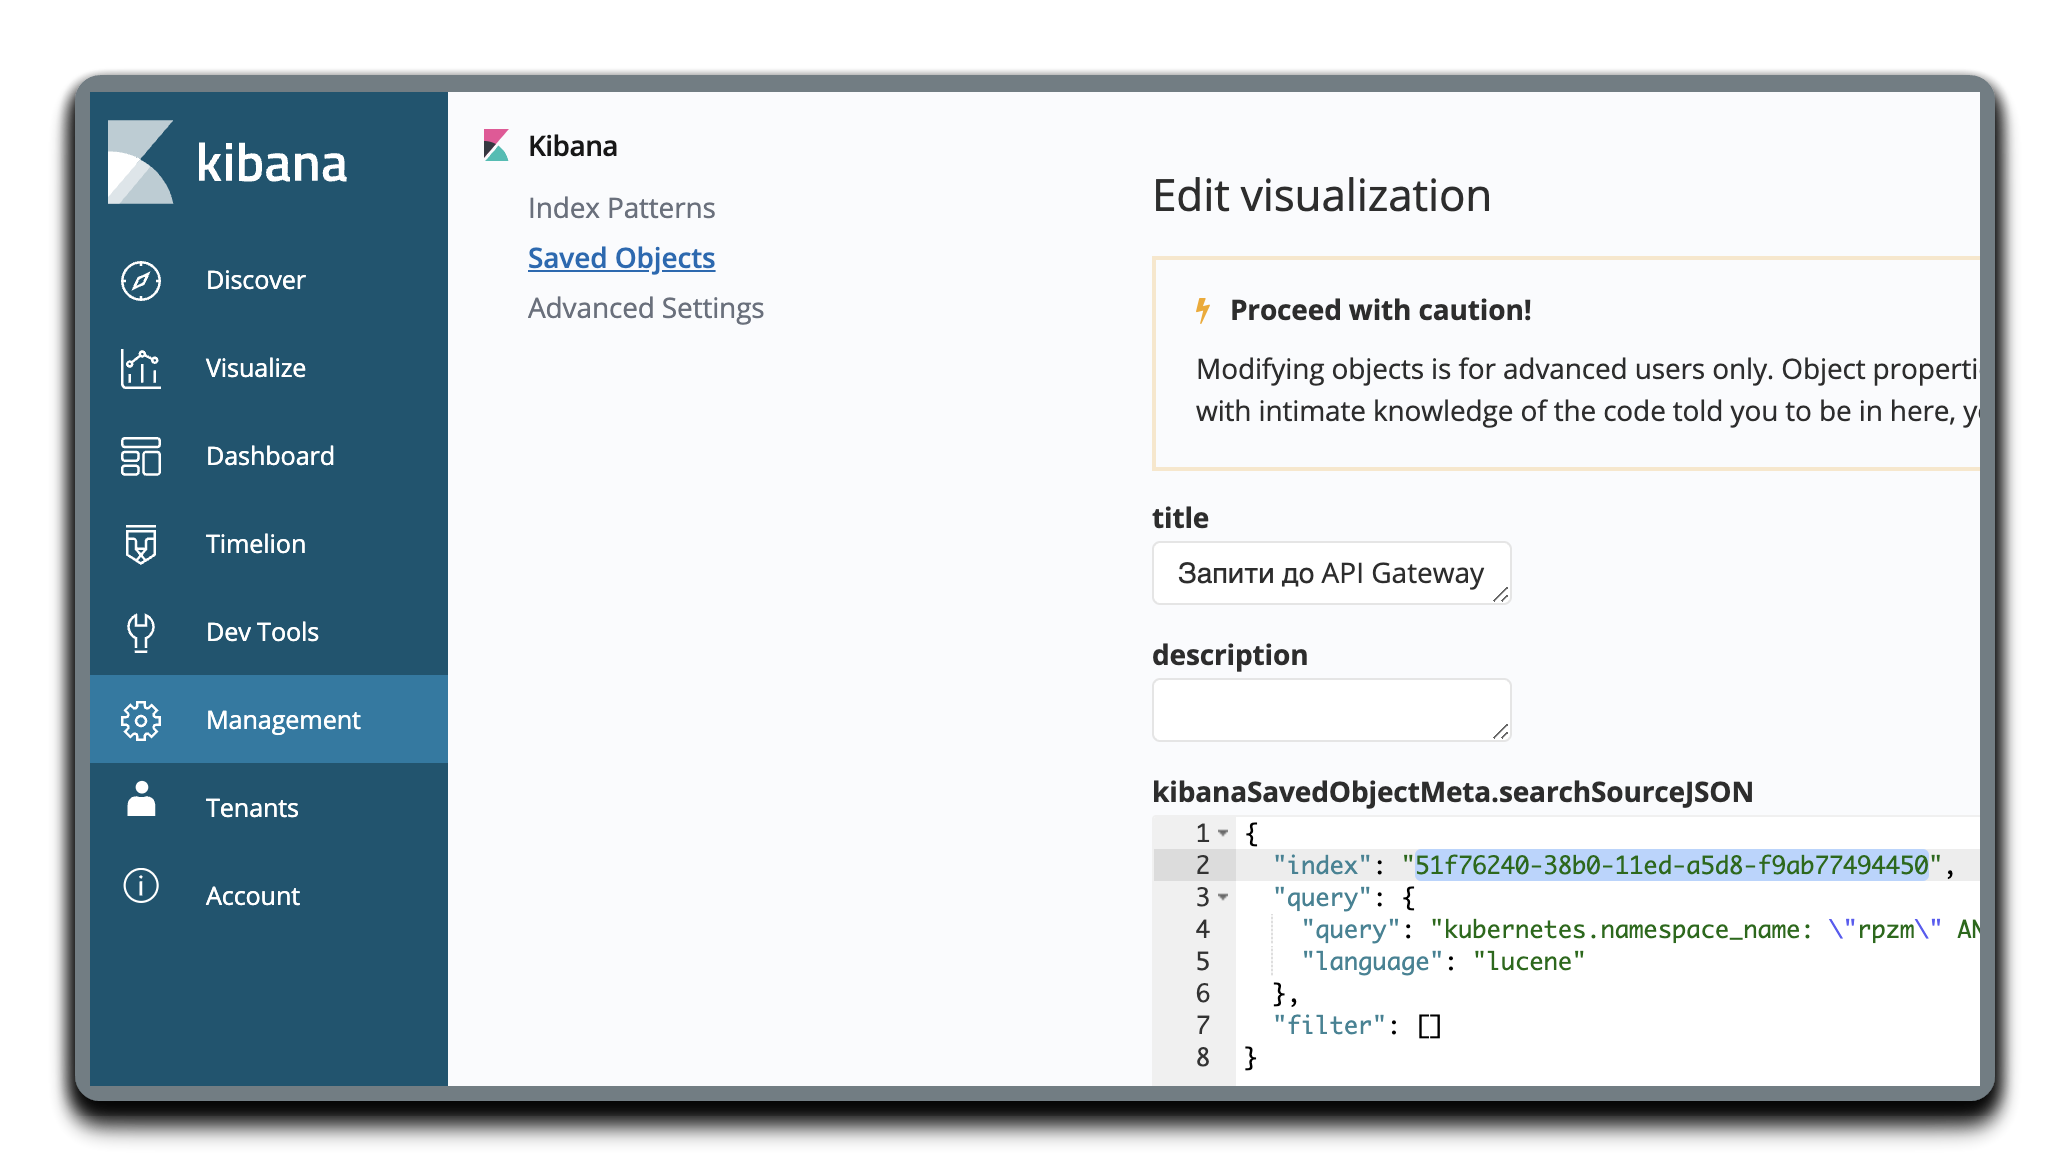
-
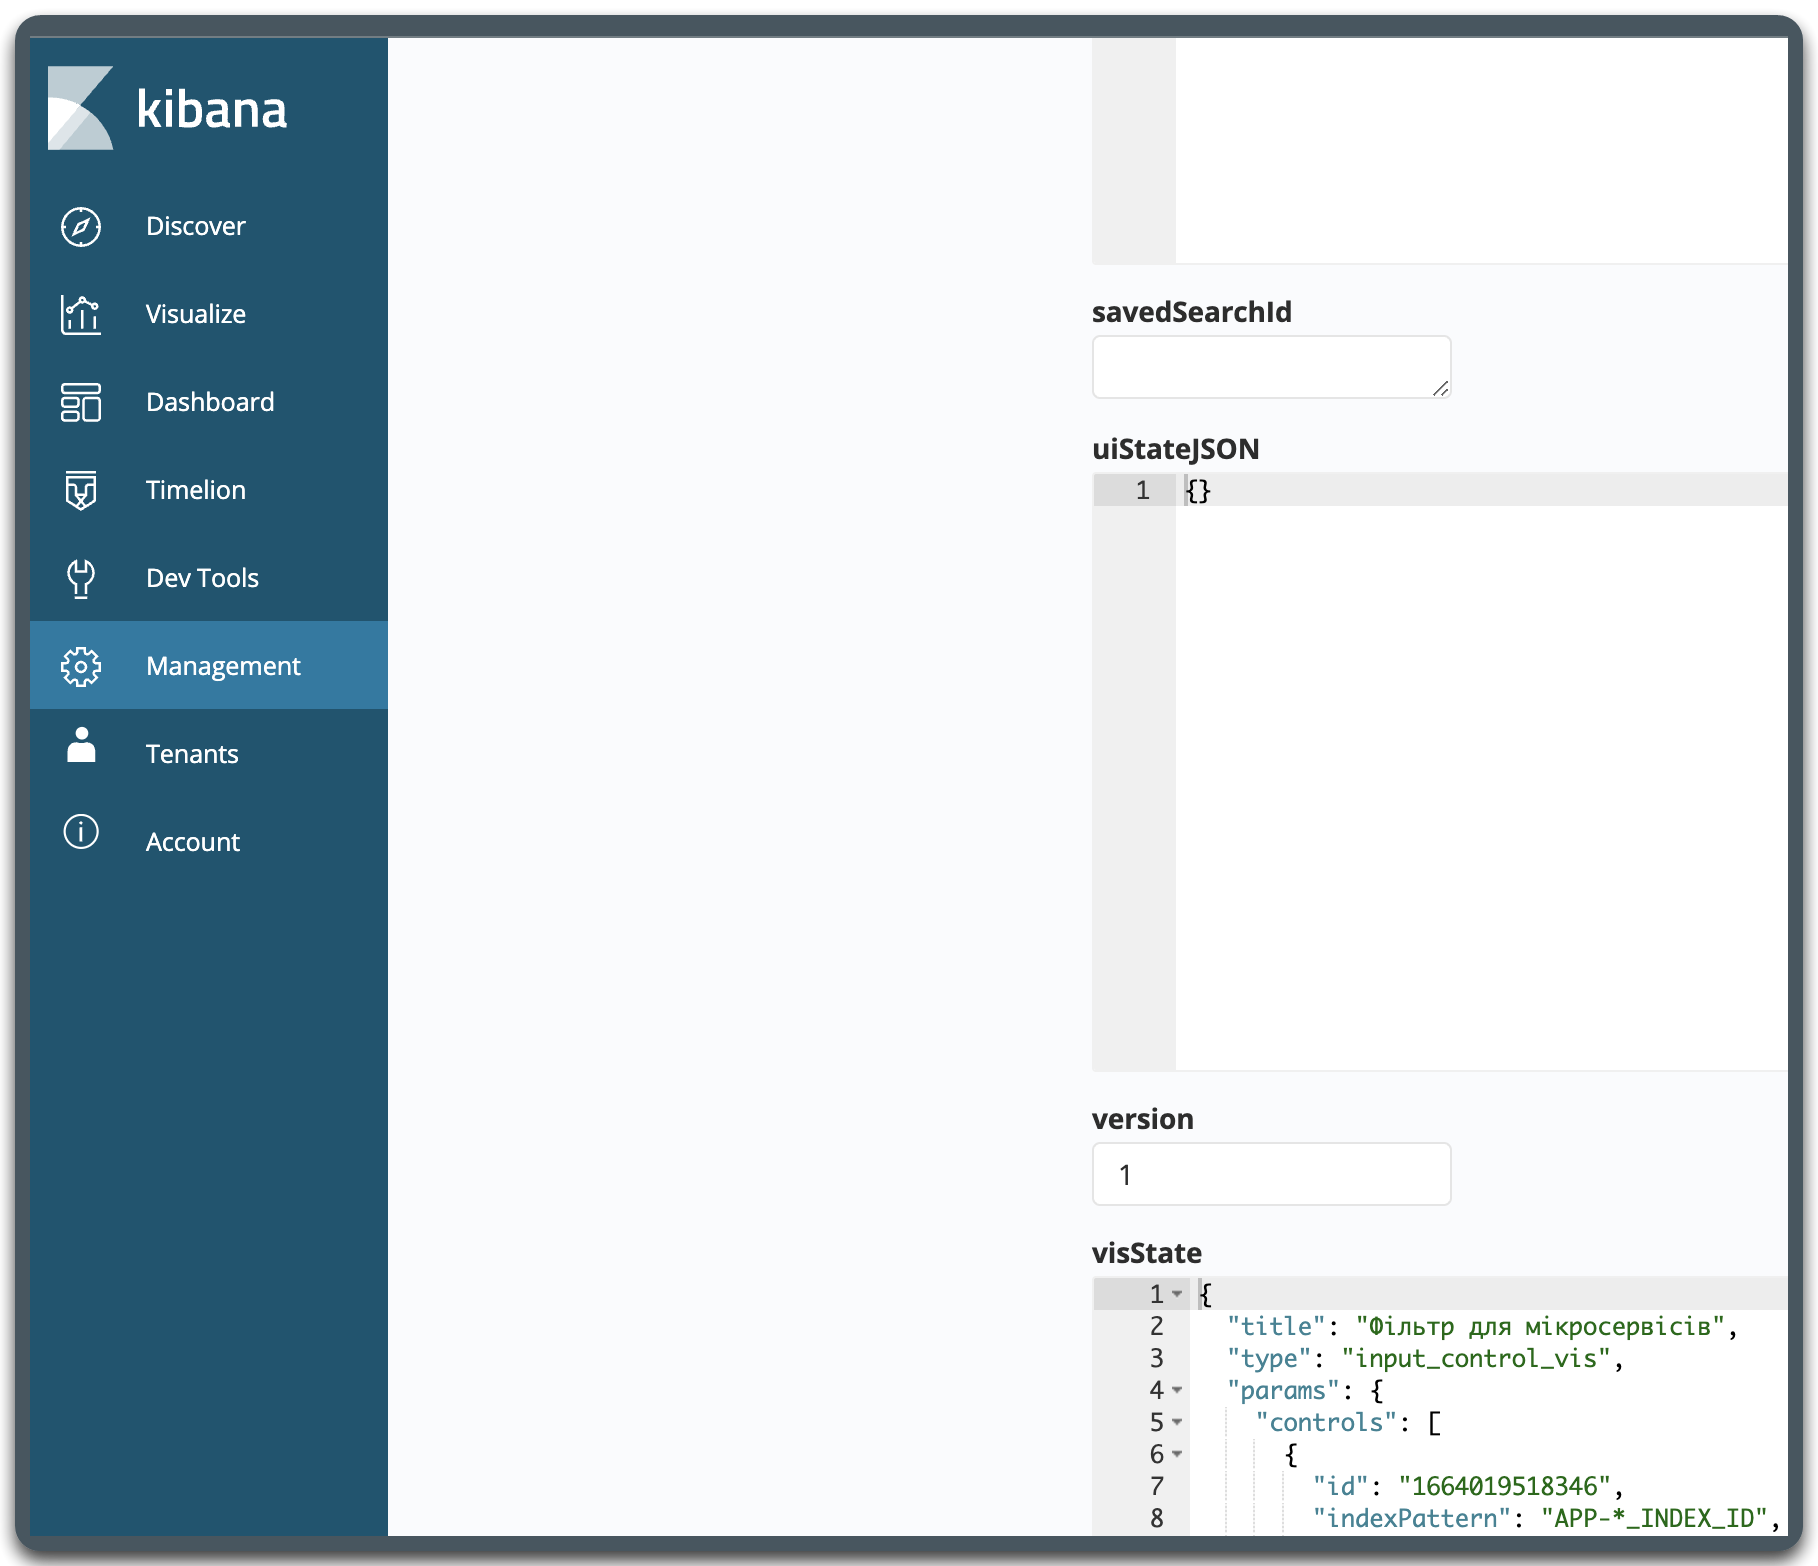
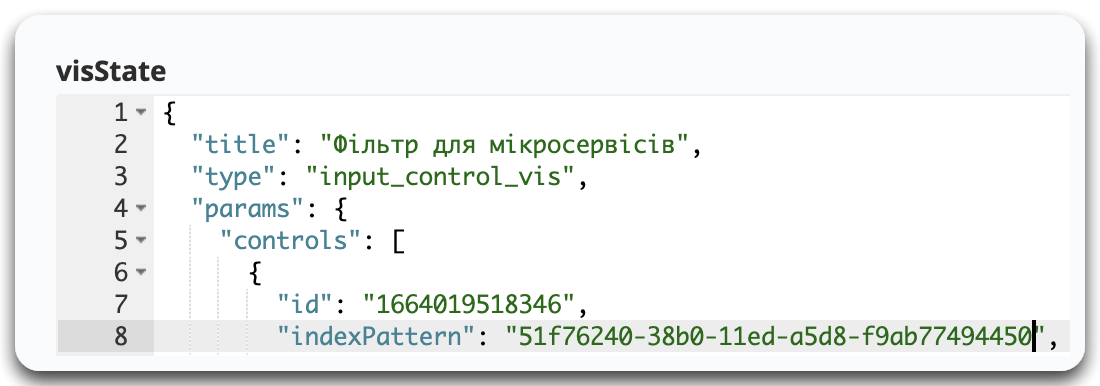
Open the Microservices filter visualization and update the
params.controls[0].indexPatternfield in thevisStatesection with the value from the previous step.Default indexPatternvalue:APP-*_INDEX_ID.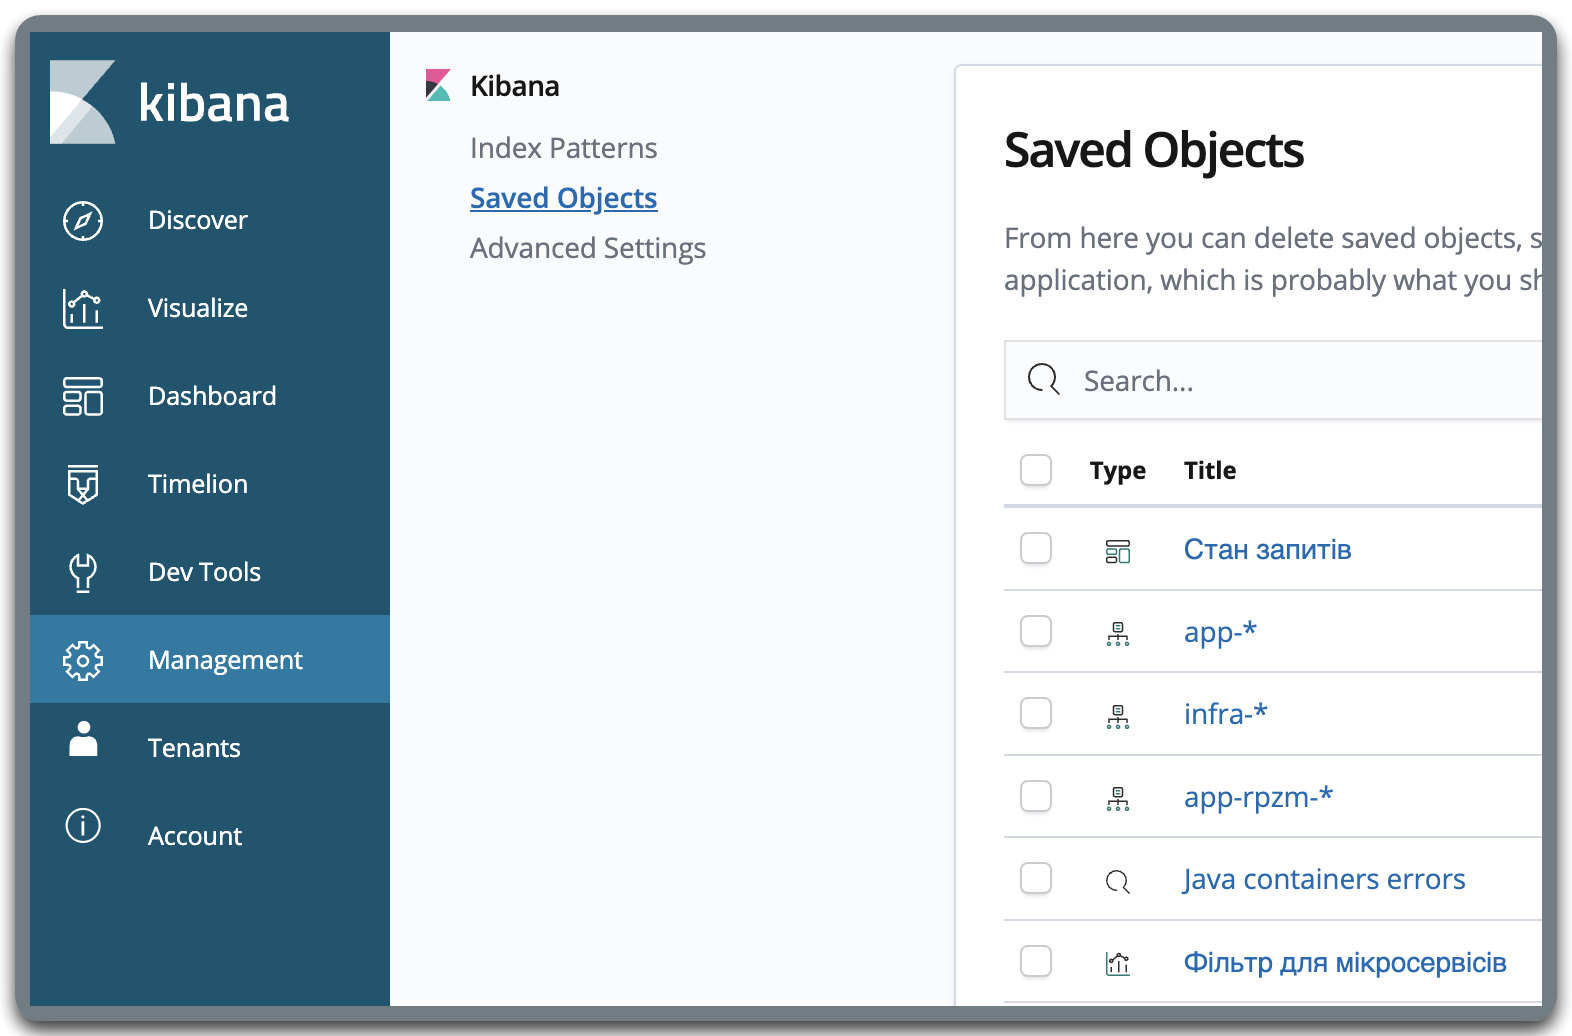
-
-
Click Save visualization object.
-
In the section, you can view the status of requests during registry operations.