Working with logs in Kibana UI
1. User manual
Kibana is a tool that visualizes all application logs. Logs of any virtual environment are recorded into the console and duplicated into Elasticsearch.
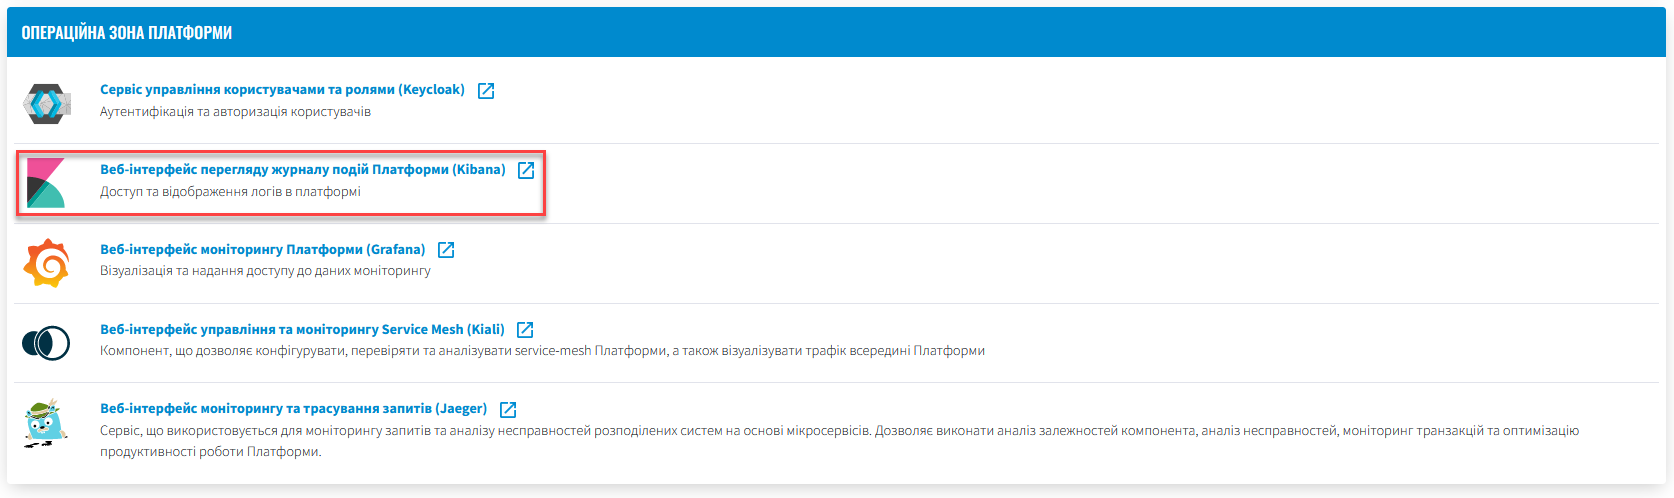
To access the records, navigate to Kibana.
|
You can get the link to Kibana technical logs in the Networking → Routes of Openshift console by specifying service name in the search.
|
To do that, take the following steps:
-
Open the application and navigate to the Management section.
-
Click
Create index patternto view logs from the indexes that get into Elasticsearch.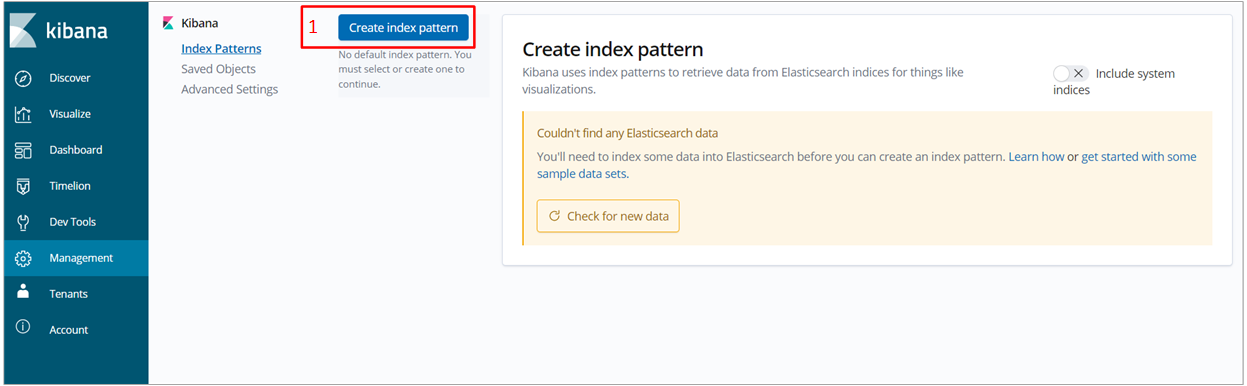
-
In the Define Index Pattern create your index-pattern according to the template. For example, if all the logs start with app-, create app-* index pattern to view the corresponding logs.
-
Click
Next stepto continue.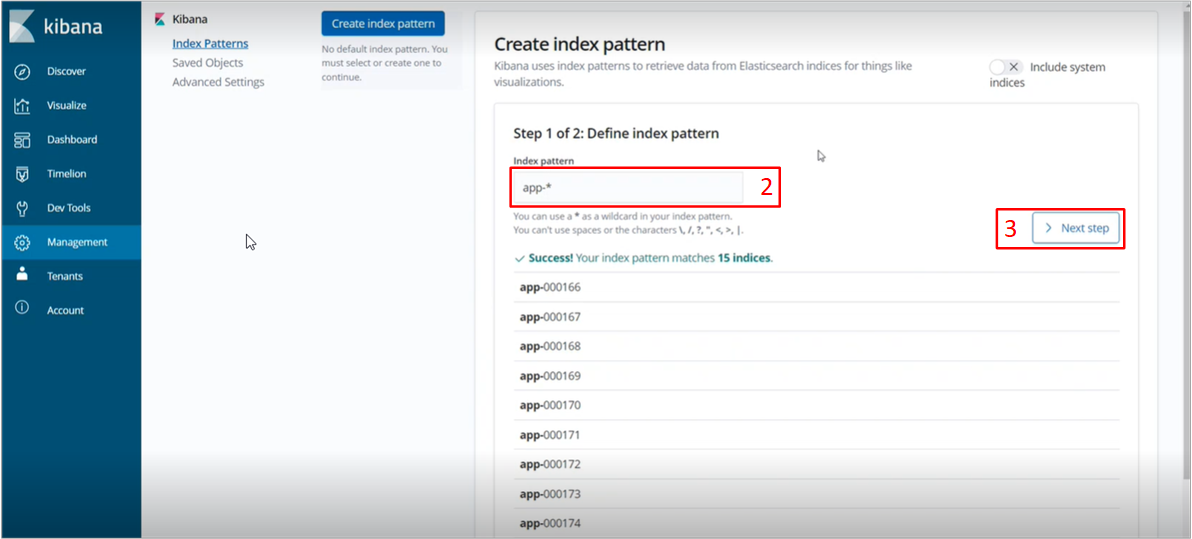
-
Use a filter in the Configure Settings tab to select the time period for the shown data.
By default, the system shows logs from the last 15 minutes. -
Click
Create Index Pattern.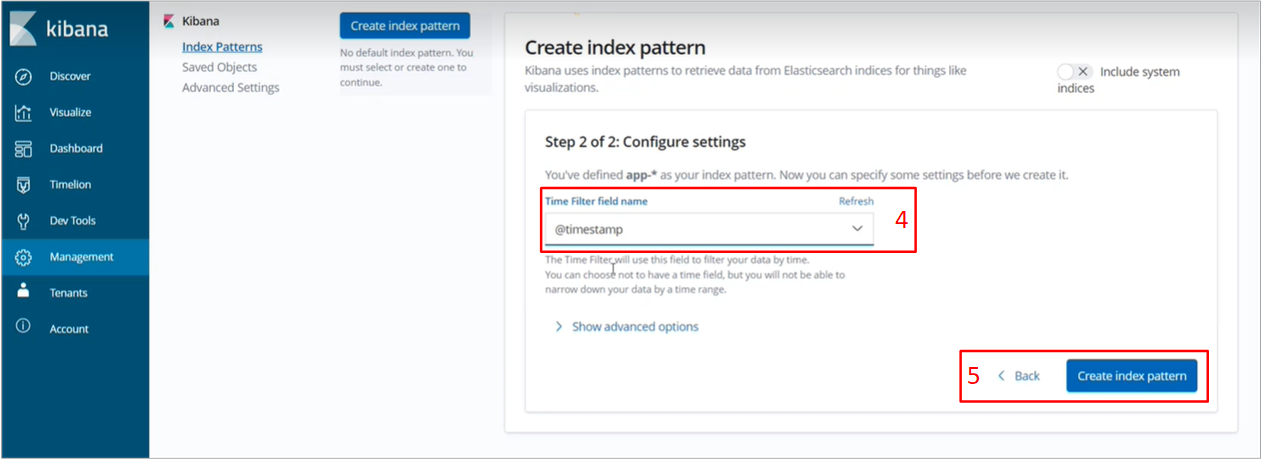
-
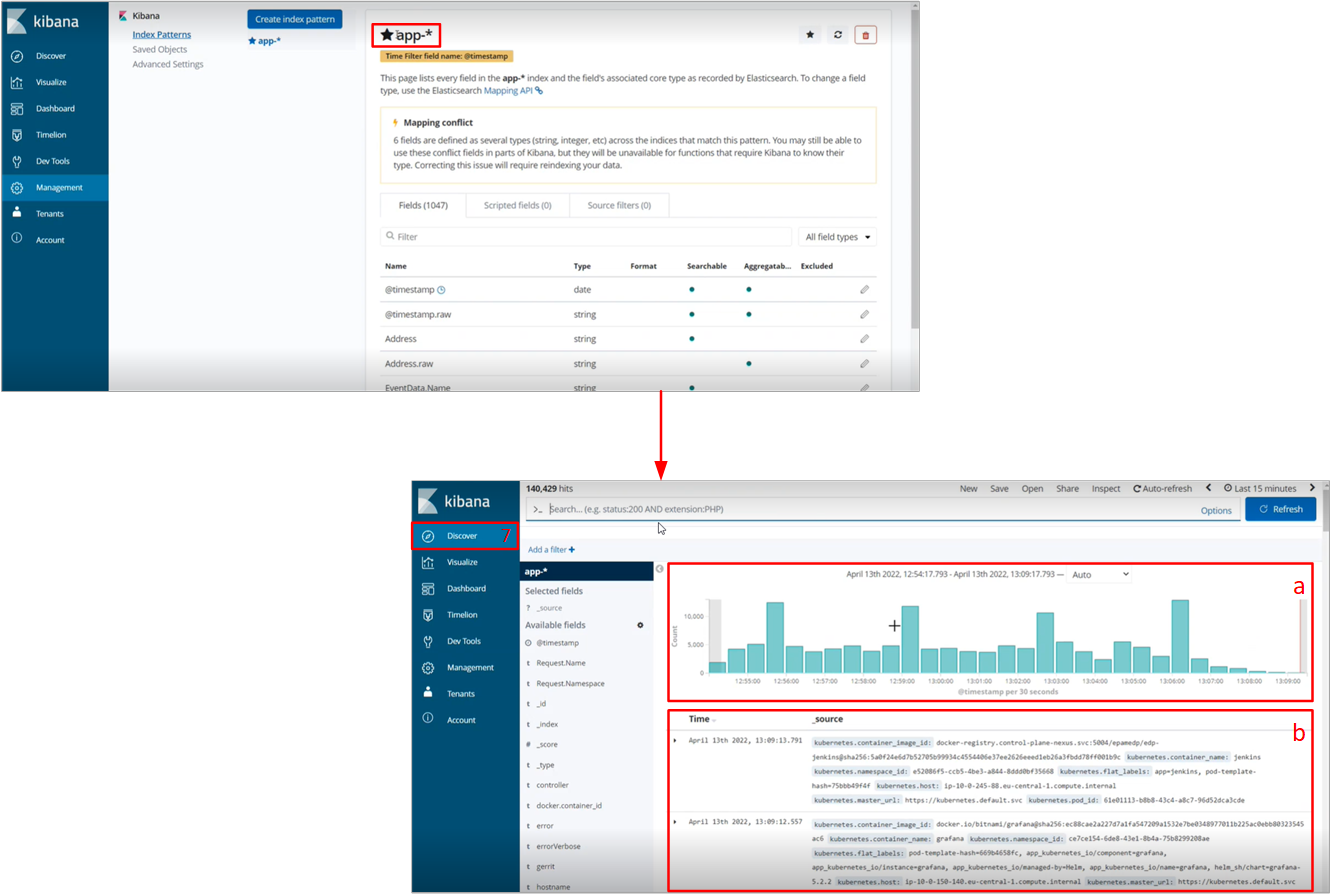
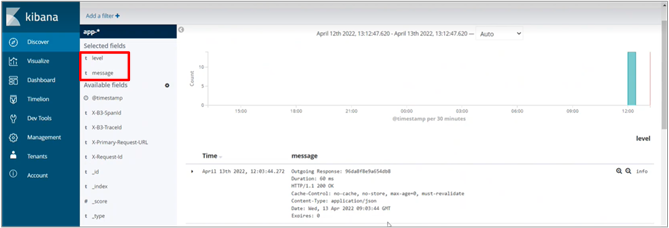
After the
app-*index-pattern has been created, navigate to the Discover tab to get the following info:-
the number of logs created in the selected period;
-
log list.
-
-
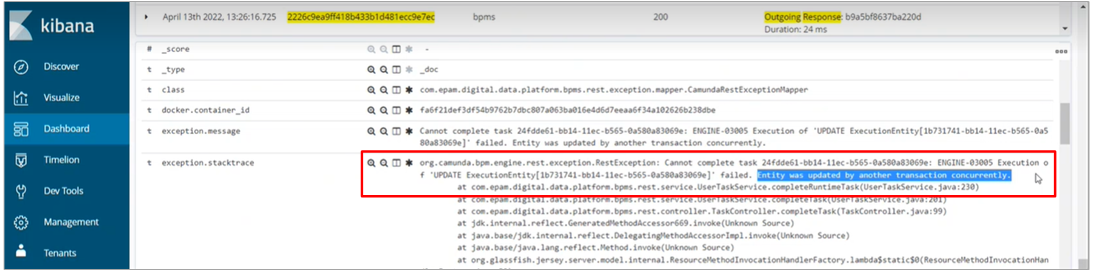
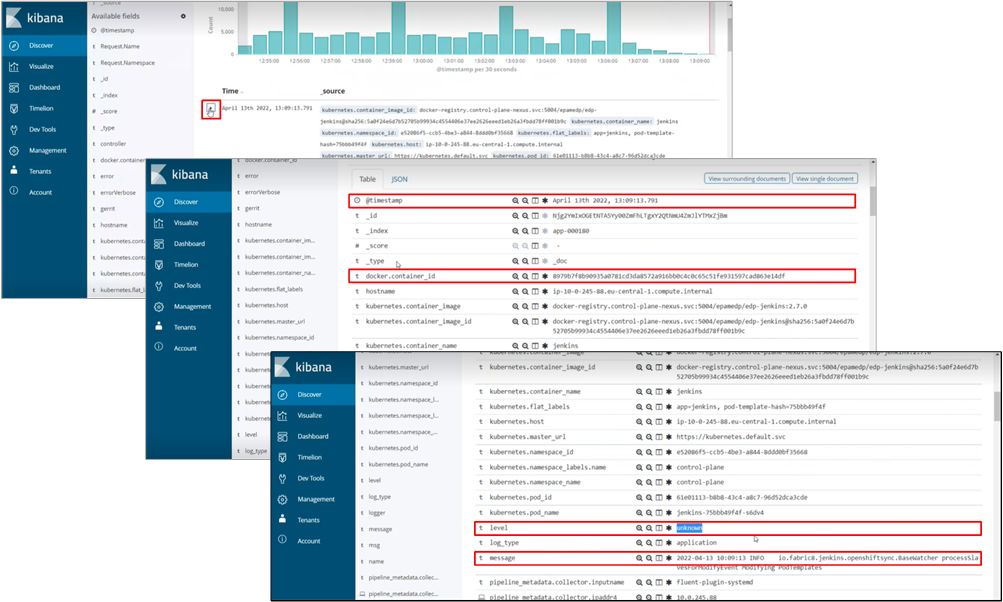
Click the icon to the left of the corresponding row to view event parameters:
-
time of the event;
-
place of the event;
-
type of the event (info/warning/error);
-
event message.
-
2. Errors
2.1. Data filtering
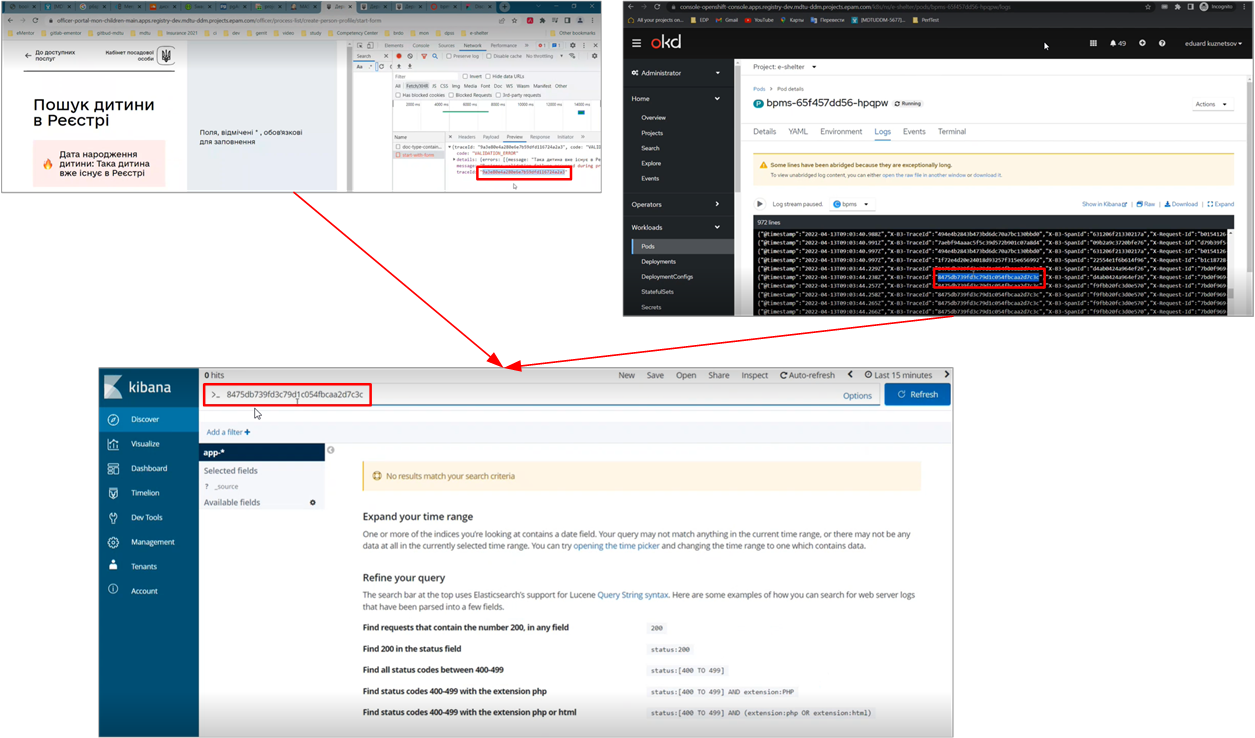
If there is an error during request processing, you can view all the info on this error with trace id, using the following methods:
- Method 1.
-
To find the logs that contain information on the corresponding event, copy the trace id in the Registry on the portal, or Openshift. Then paste it to the search line in the Discover tab and specify the time period that you need the data for.
- Method 2.
-
Navigate to the Filter window in Discover tab, select
X-B3-Traceid, thenis, and clickSave.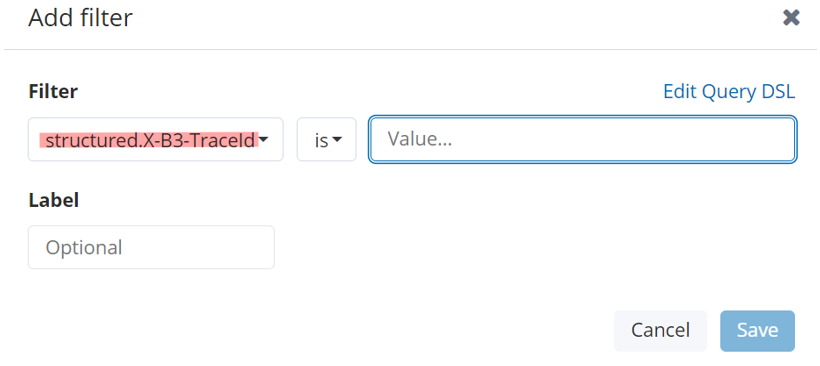
The resulting logs will have the given trace id. To control the number of results, and filter out less relevant search data, configure the corresponding fields, selecting Message and Level in the list to the left.
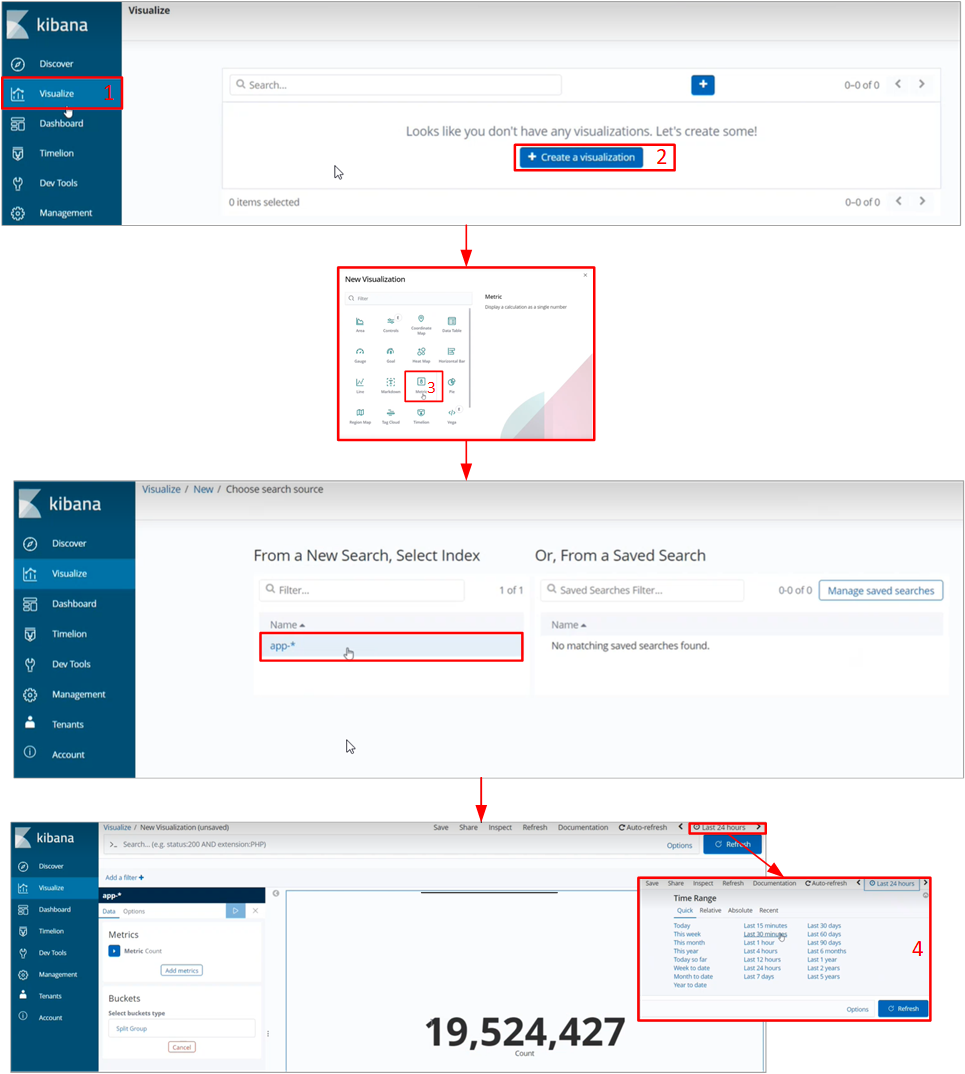
2.2. Data visualisation
Kibana allows you to visualize information using different charts. To do that, take the following steps:
-
Select the Visualize tab;
-
Click
Create visualization; -
Select visualization type;
-
Specify the timpe period for the data.
You can see all the visualizations on the same dashboard in the Dashboard tab.
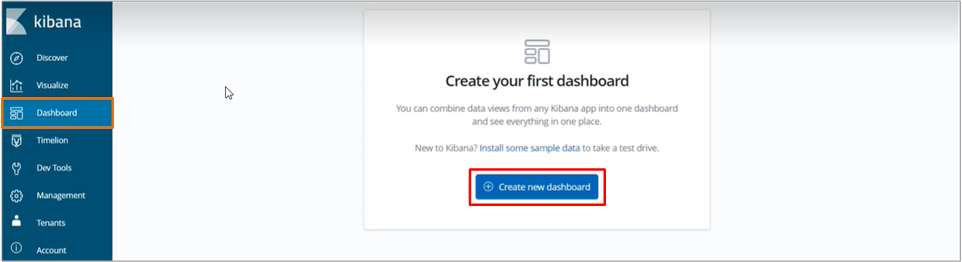
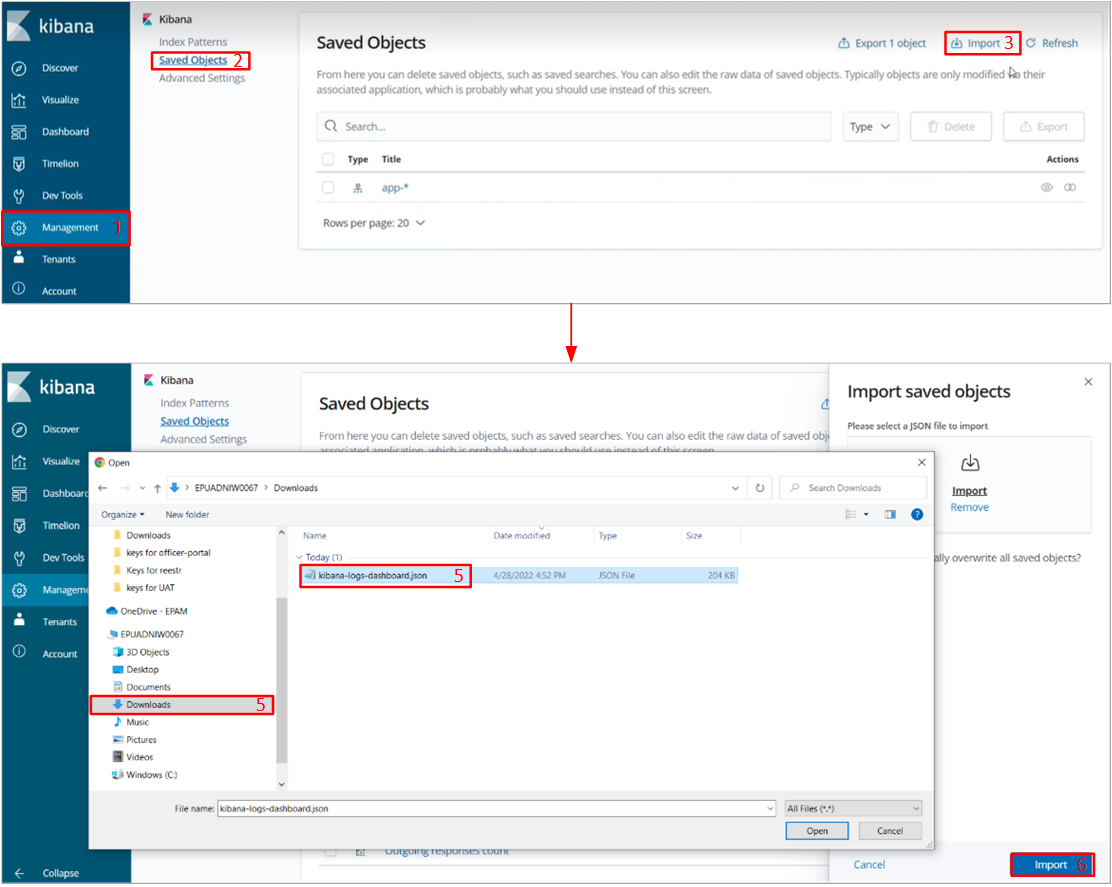
2.3. Dashboard import
To import a dashboard, download the kibana-logs-dashboard.json file.
When done, take the following steps:
-
Select the Management tab.
-
Click
Saved Objects. -
Click
Import. -
In the prompt window, click
Importagain. -
When the download is complete, navigate to the Downloads folder and select kibana-logs-dashboard.json.
-
Click
ImportandDone, to import all the objects that contain:-
dashboard;
-
the created index-pattern;
-
all visualizations.
-
After completing the import, take the following steps to get consolidated information from all the logs:
-
Navigate to the Dashboard tab.
-
Select
Logs Dashboardfrom the list.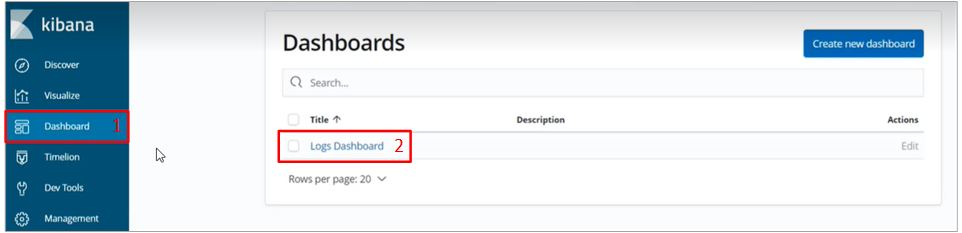
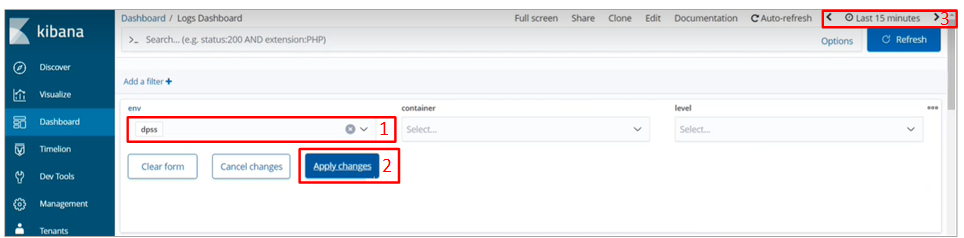
-
Select the environment using filters.
-
Click
Apply changesto get information on the environment aggregated in the last 15 minutes. -
Use filter to specify the required time period.
2.4. Working with charts
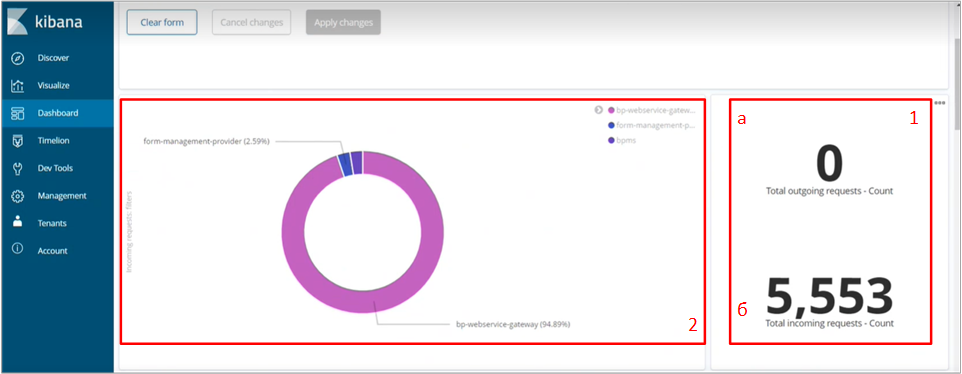
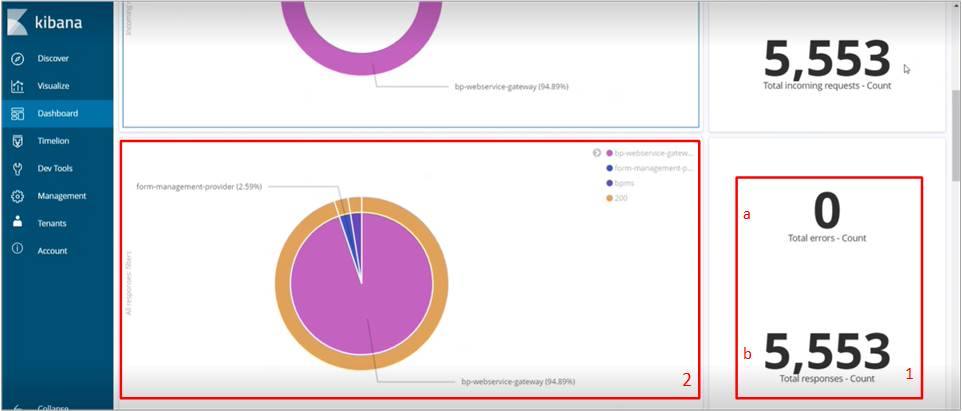
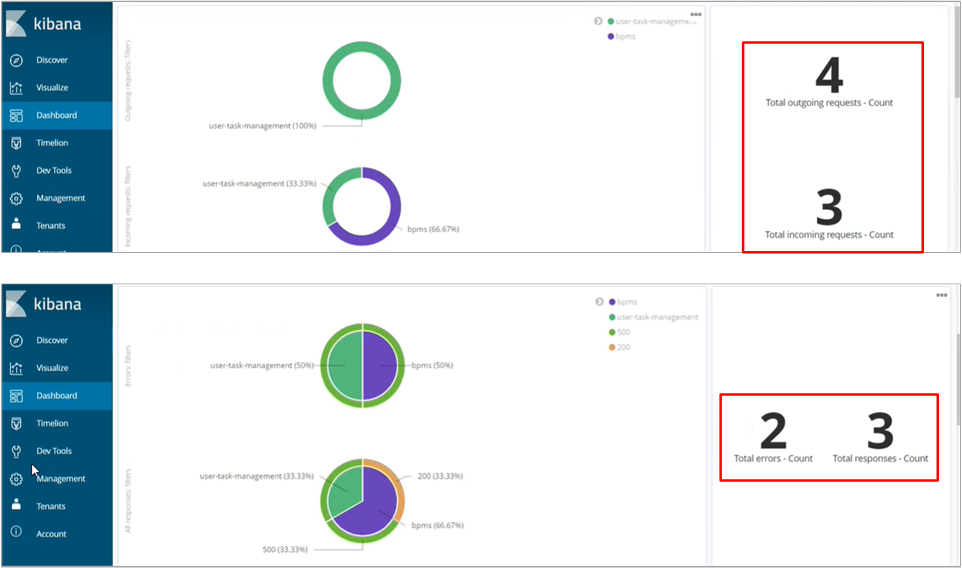
Charts and tables contain the following information:
-
the general number of requests in the specified time period:
-
incoming;
-
outgoing.
-
-
the number of incoming requests by environment.
-
the general number of:
-
errors;
-
replies.
-
-
the number of replies by environment.
Requests and replies are events recorded in dedicated logs. The number of replies must be equal to the number of requests.
Successful replies are characterized by a numeric code, which is less than 500. Replies with a code of 500 or higher are errors.
-
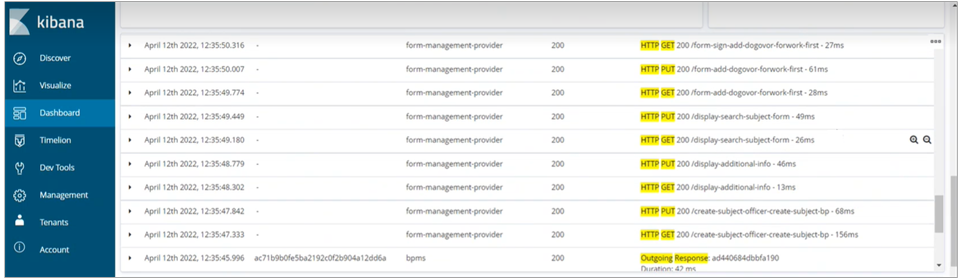
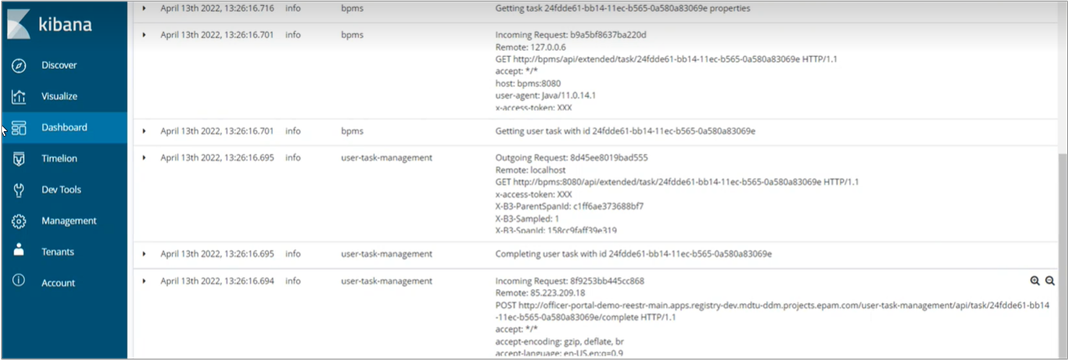
http traffic (the list of requests and replies)
-
all the logs that contain information required to investigate the reasons for failed requests;
-
next, filter the info by the specified trace id;
-
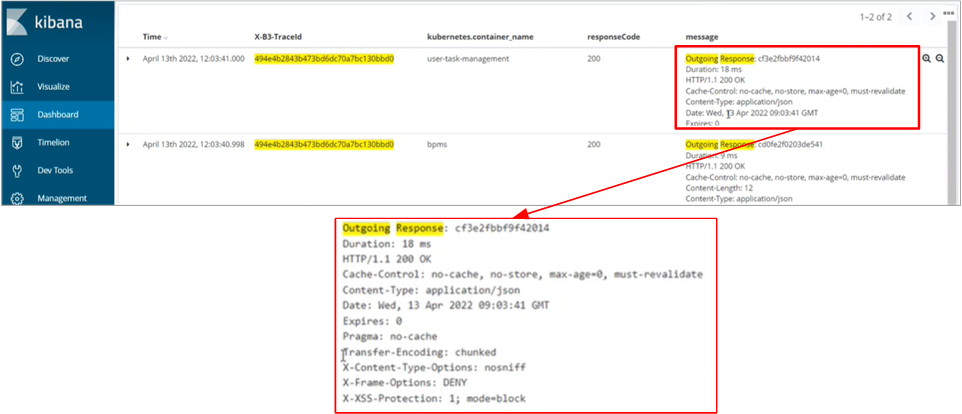
you can see how many requests and replies match this trace id, and all the logs and log records that contain the following info:
-
request duration;
-
headers;
-
reply status-code;
-
message;
-
all the logs that match the id.
-
-
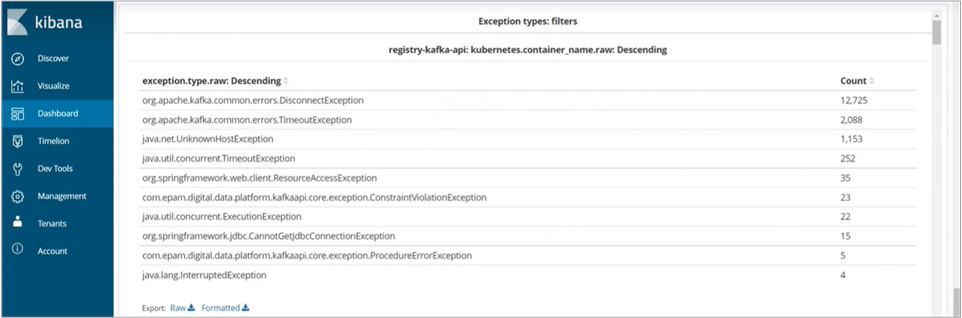
exceptions are sorted by number from high to low, and contain the following info:
-
which exceptions occured;
-
the service the exceptions occured on.
-
To get detailed info on an exception:
-
select the time;
-
navigate to the
containerfield and select the name of the service, where the error has occured; -
click
apply changes.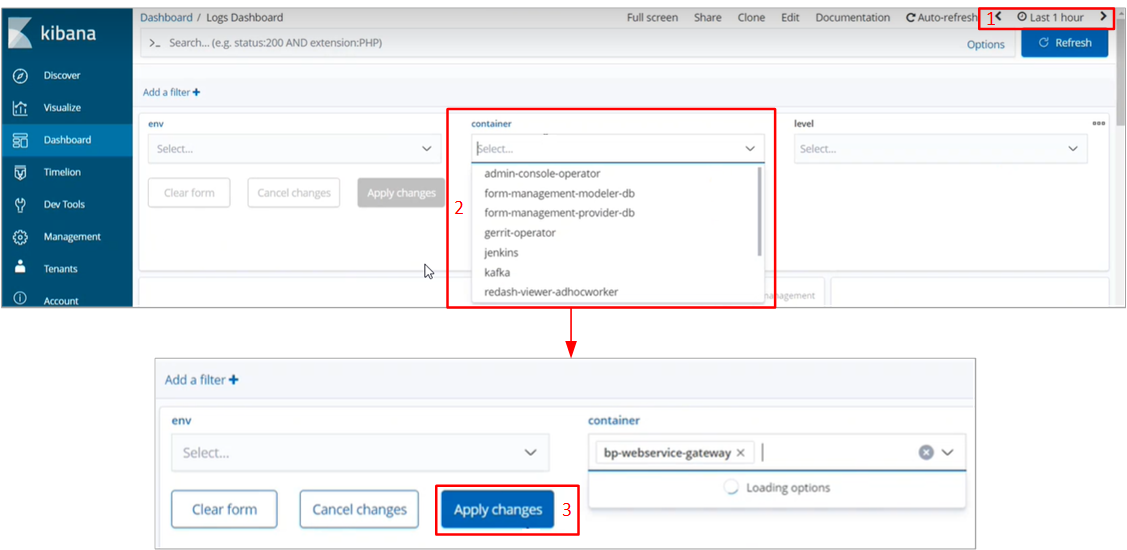
If the error does not belong to a particular service:
-
Copy error name.
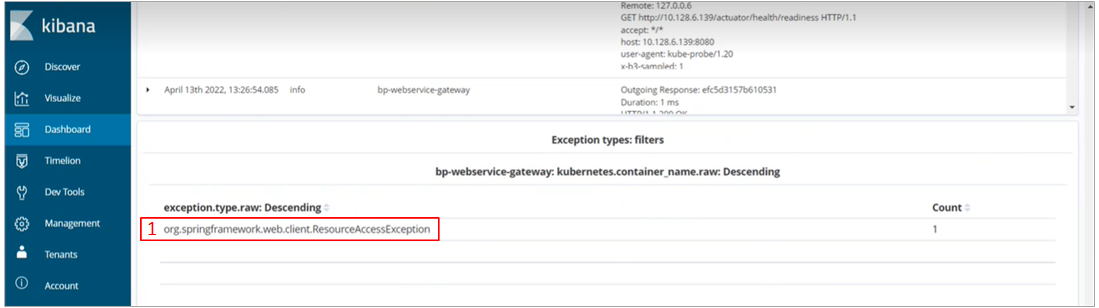
-
Enter the name into the search field (it is recommended to use quotes
""to get a more precise result).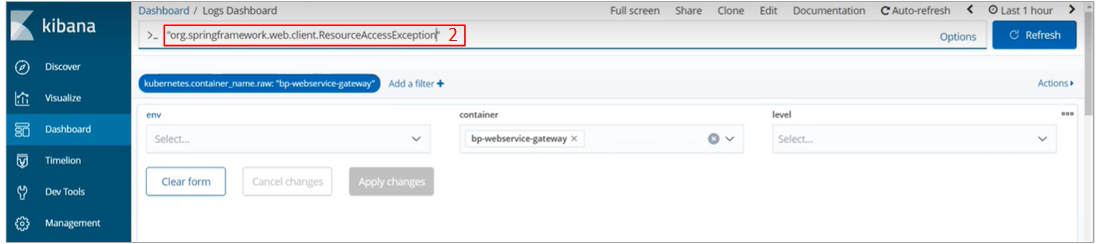
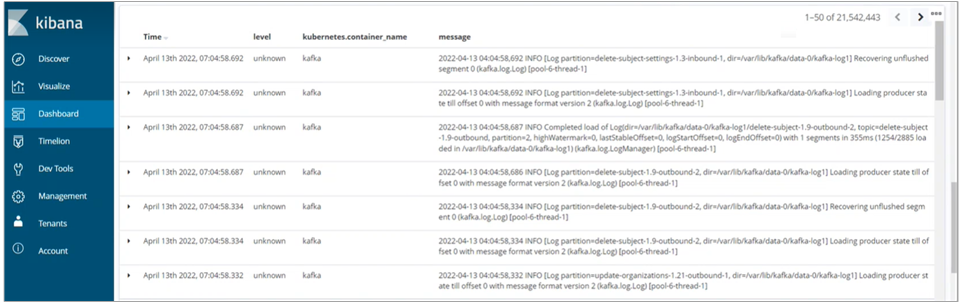
The table below shows the following data:
-
time;
-
error level;
-
message.
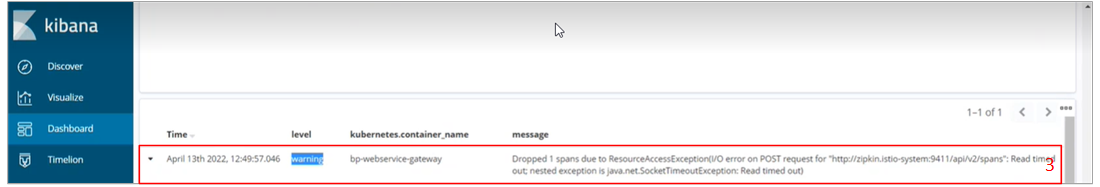
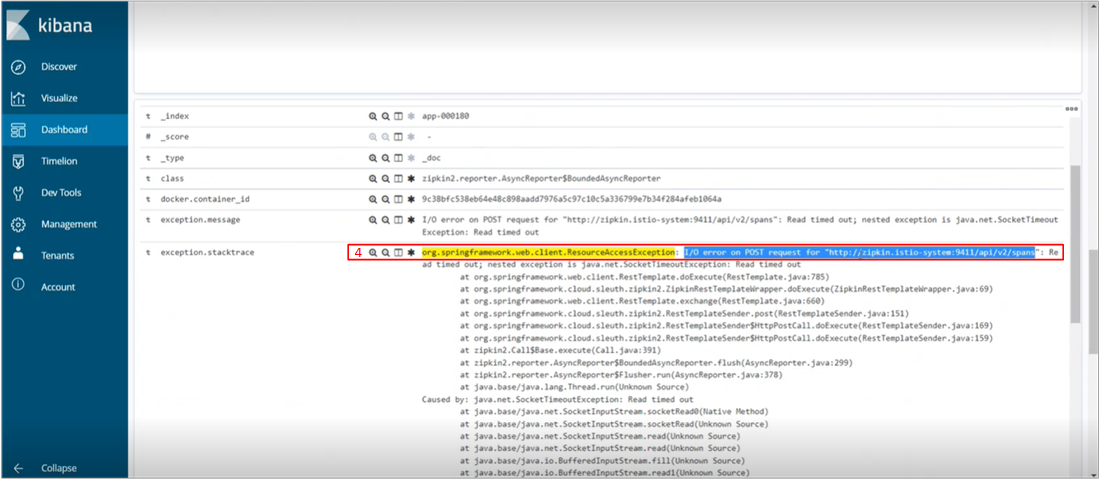
The message section contains detailed information on the error and its reasons.
The Dashboard tab shows the number of errors that occured in the selected time period.
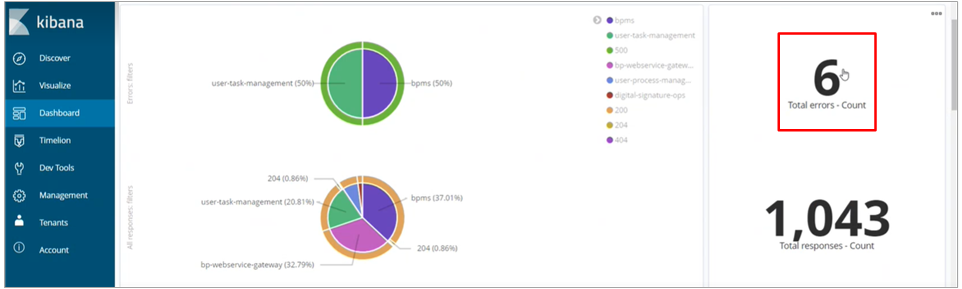
Clicking a number will filter errors by reply code: 501, 502, 503, 504, 505.
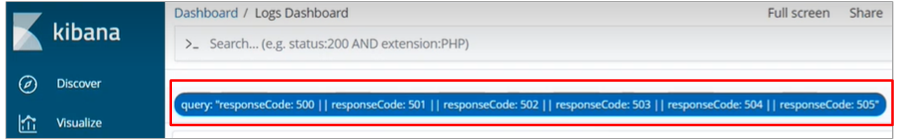
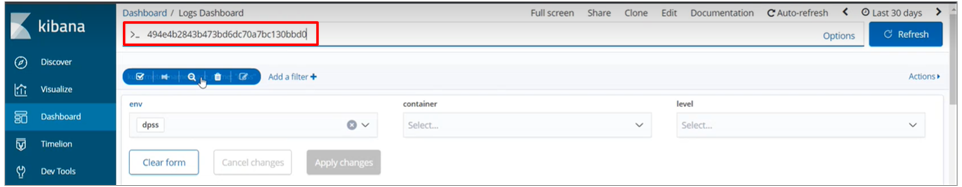
You can find the information on these codes below. Requests can be filtered by trace id in the search field of the Dashboard tab.
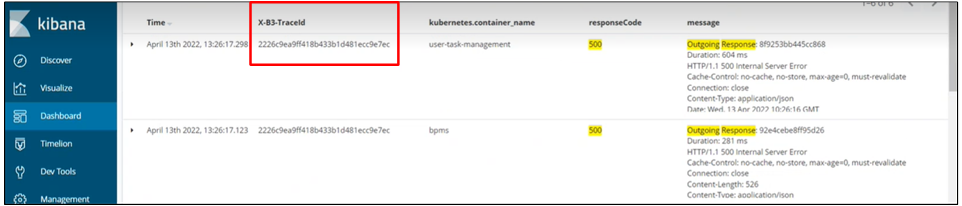
Here you can see the number of requests, replies, and errors with the specified trace id.
Navigate to the table containing all the information on the failed request. The information is sorted by time, so start reading from the bottom.
The table allows you to follow the entire path of the request and find where the error appeared, and its reasons.
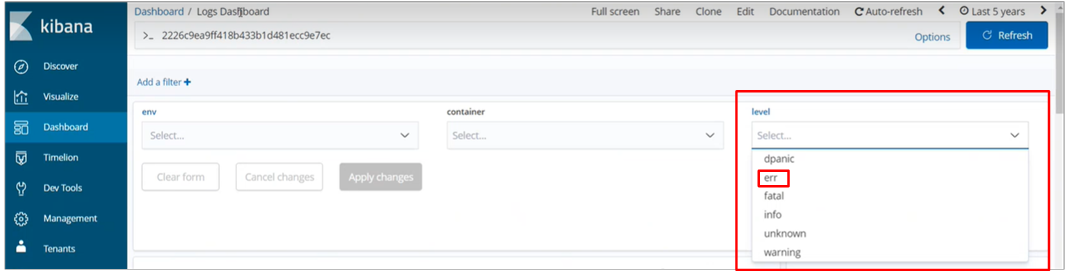
The request with an error always has an exception that tells us why the error appeared. To see it, check the level section, which may have one of the following values:
-
info - information on the state of events;
-
warning - warning;
-
error - error.
The former two values are non-critical and don’t require any special attention.
To find the error, filter by err on the Dashboard tab.
In the resulting logs, click the arrow on the right to see the detailed info.
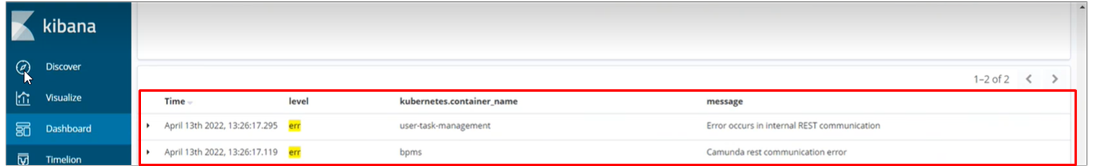
This will provide all the information on the error and its reason.