Monitoring metrics of public API
| 🌐 This document is available in both English and Ukrainian. Use the language toggle in the top right corner to switch between versions. |
1. Dashboard overview
The Platform features a Grafana dashboard designed to monitor performance metrics and the volume of requests made to public integration points from unauthenticated users and third-party systems.
The registry’s technical administrators can utilize data from the dashboard to monitor trends and the state of metrics. This information can assist in determining the need for optimization adjustments, such as altering request limits.
2. Accessing the dashboard
To view the dashboard, follow these steps:
-
Log in to the Control Plane administrative panel.
-
Select your registry >
Edit> Quick Links.For more on quick links, refer to the page Quick links to registry services. -
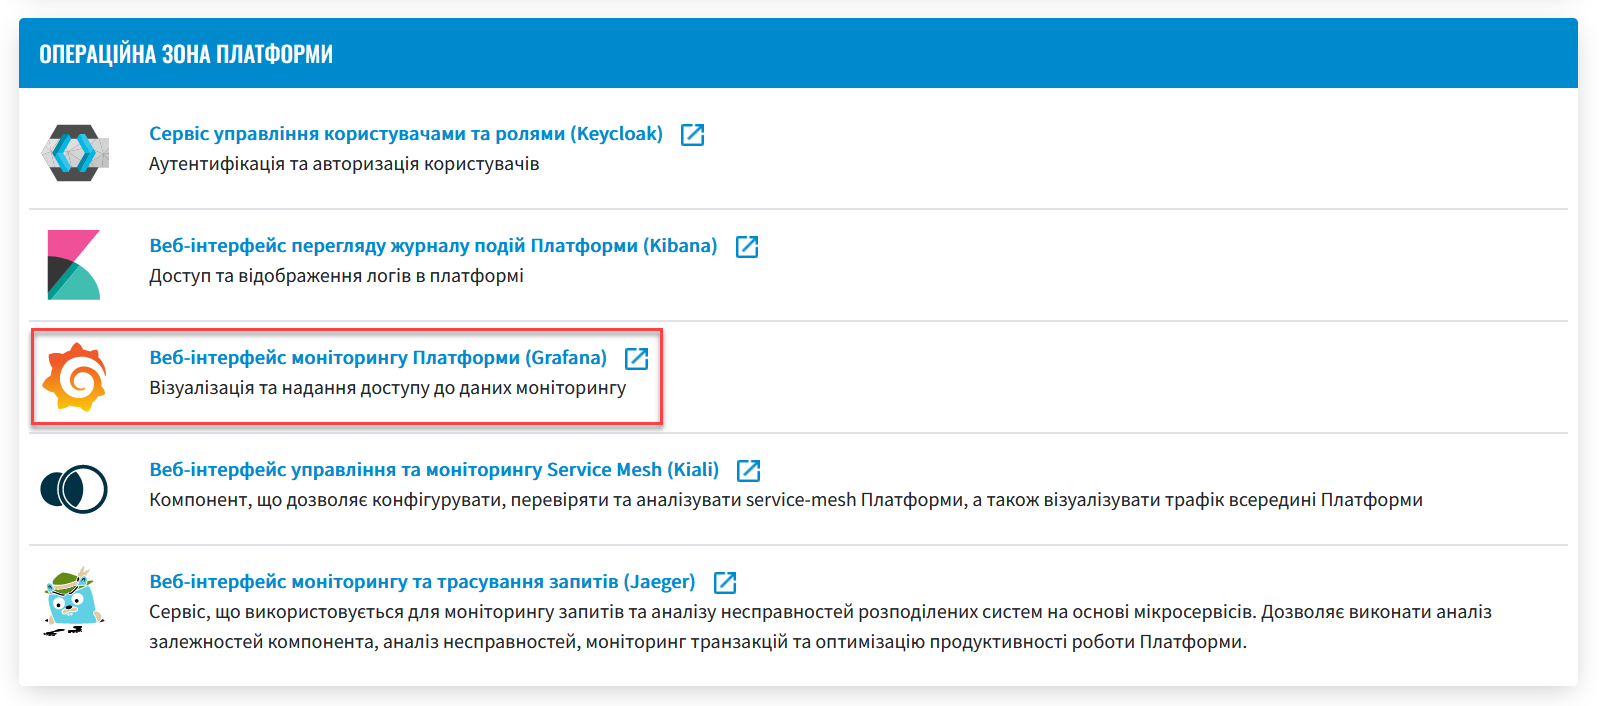
Follow the link to the Platform’s monitoring web interface – Grafana.
-
Sign in using the
Sign in with OAuthoption.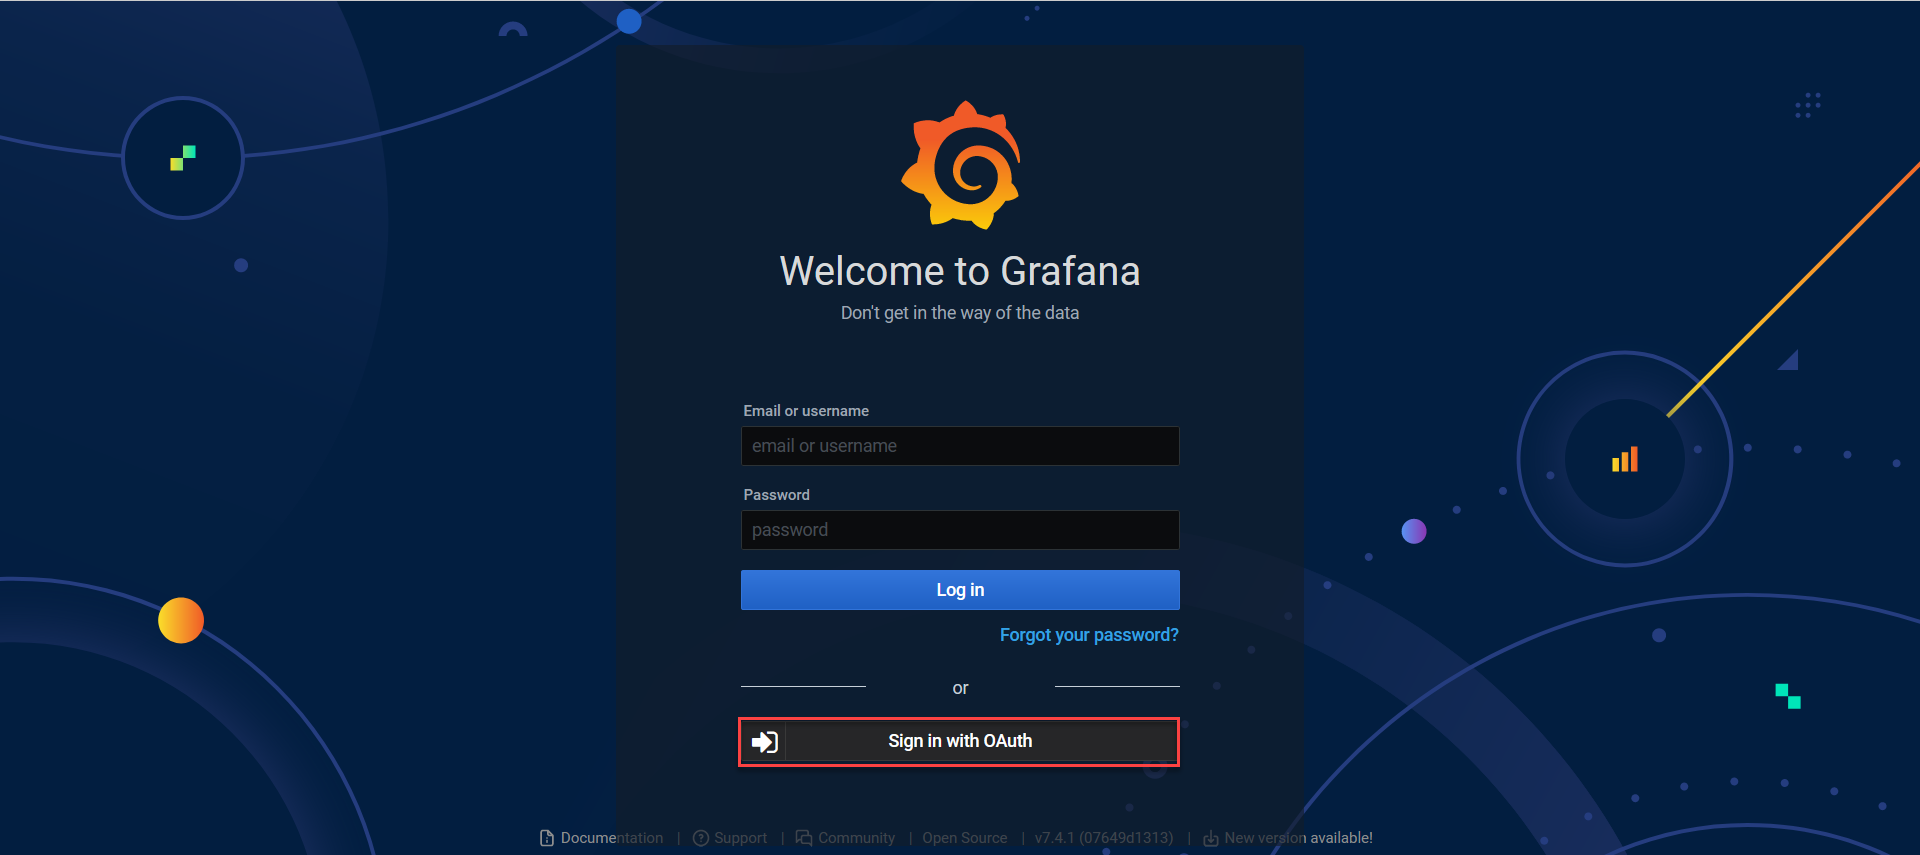
-
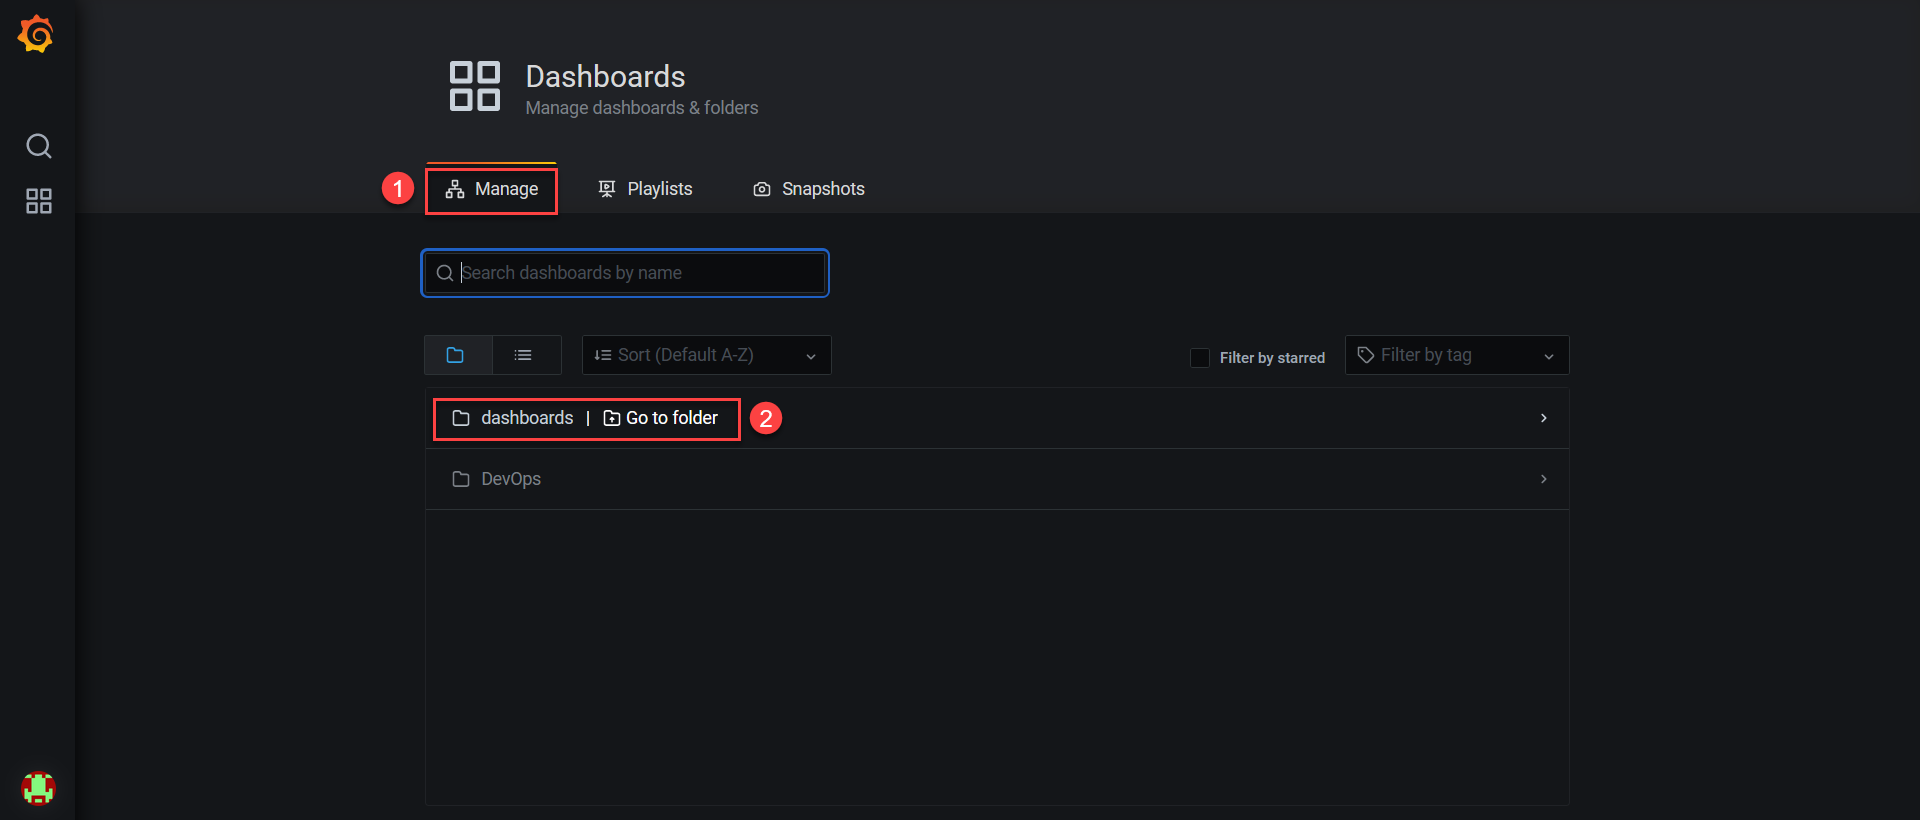
On the left sidebar, select Manage > Dashboards > Go to folder.
-
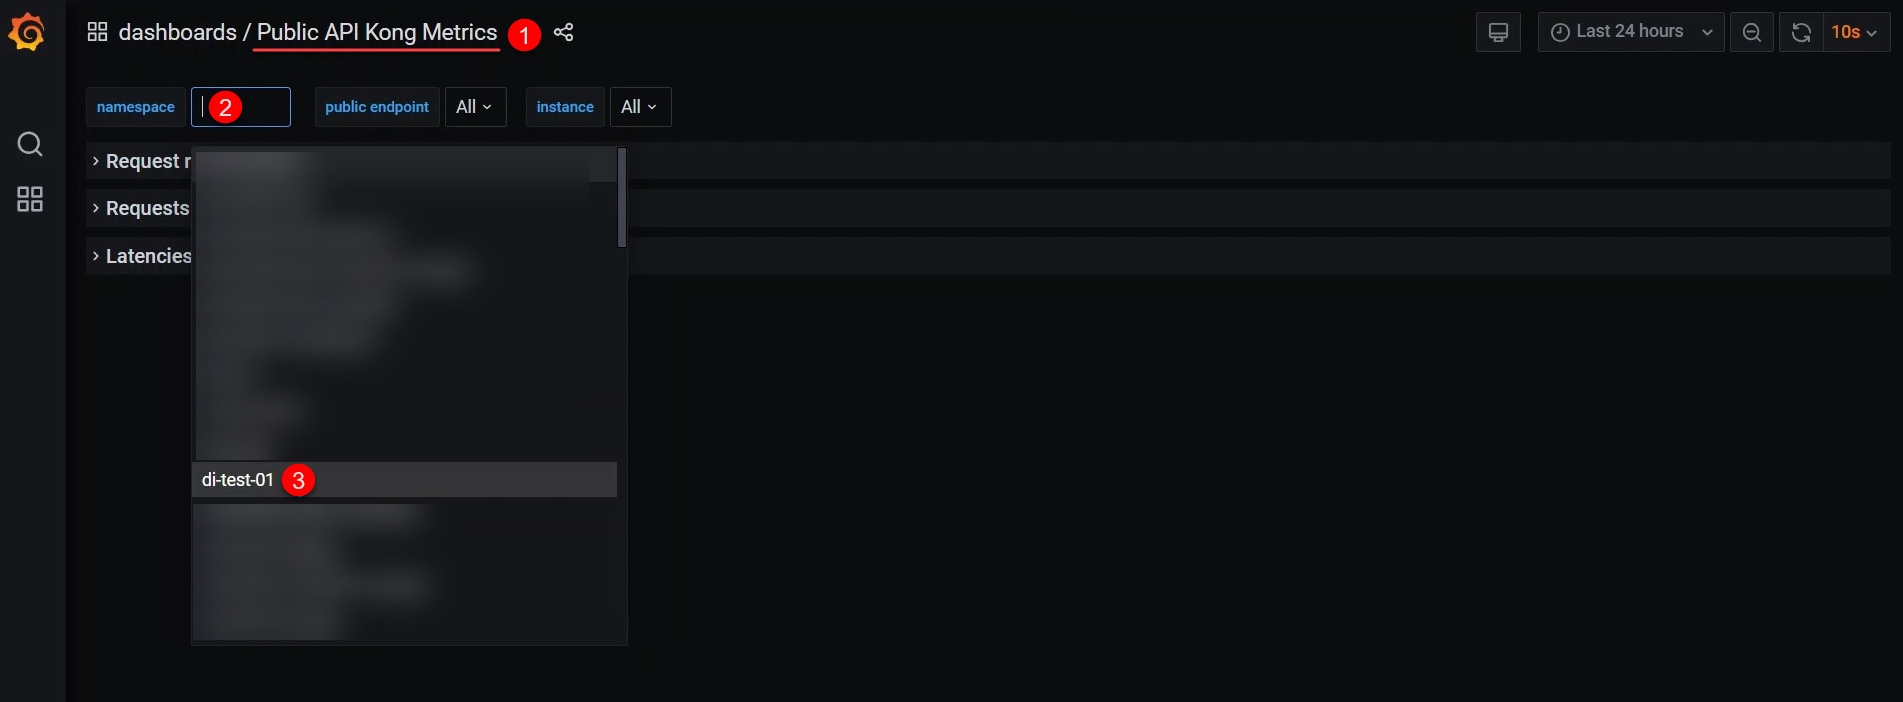
In the search bar, locate Public API Kong Metrics, click namespace, and then select your registry.
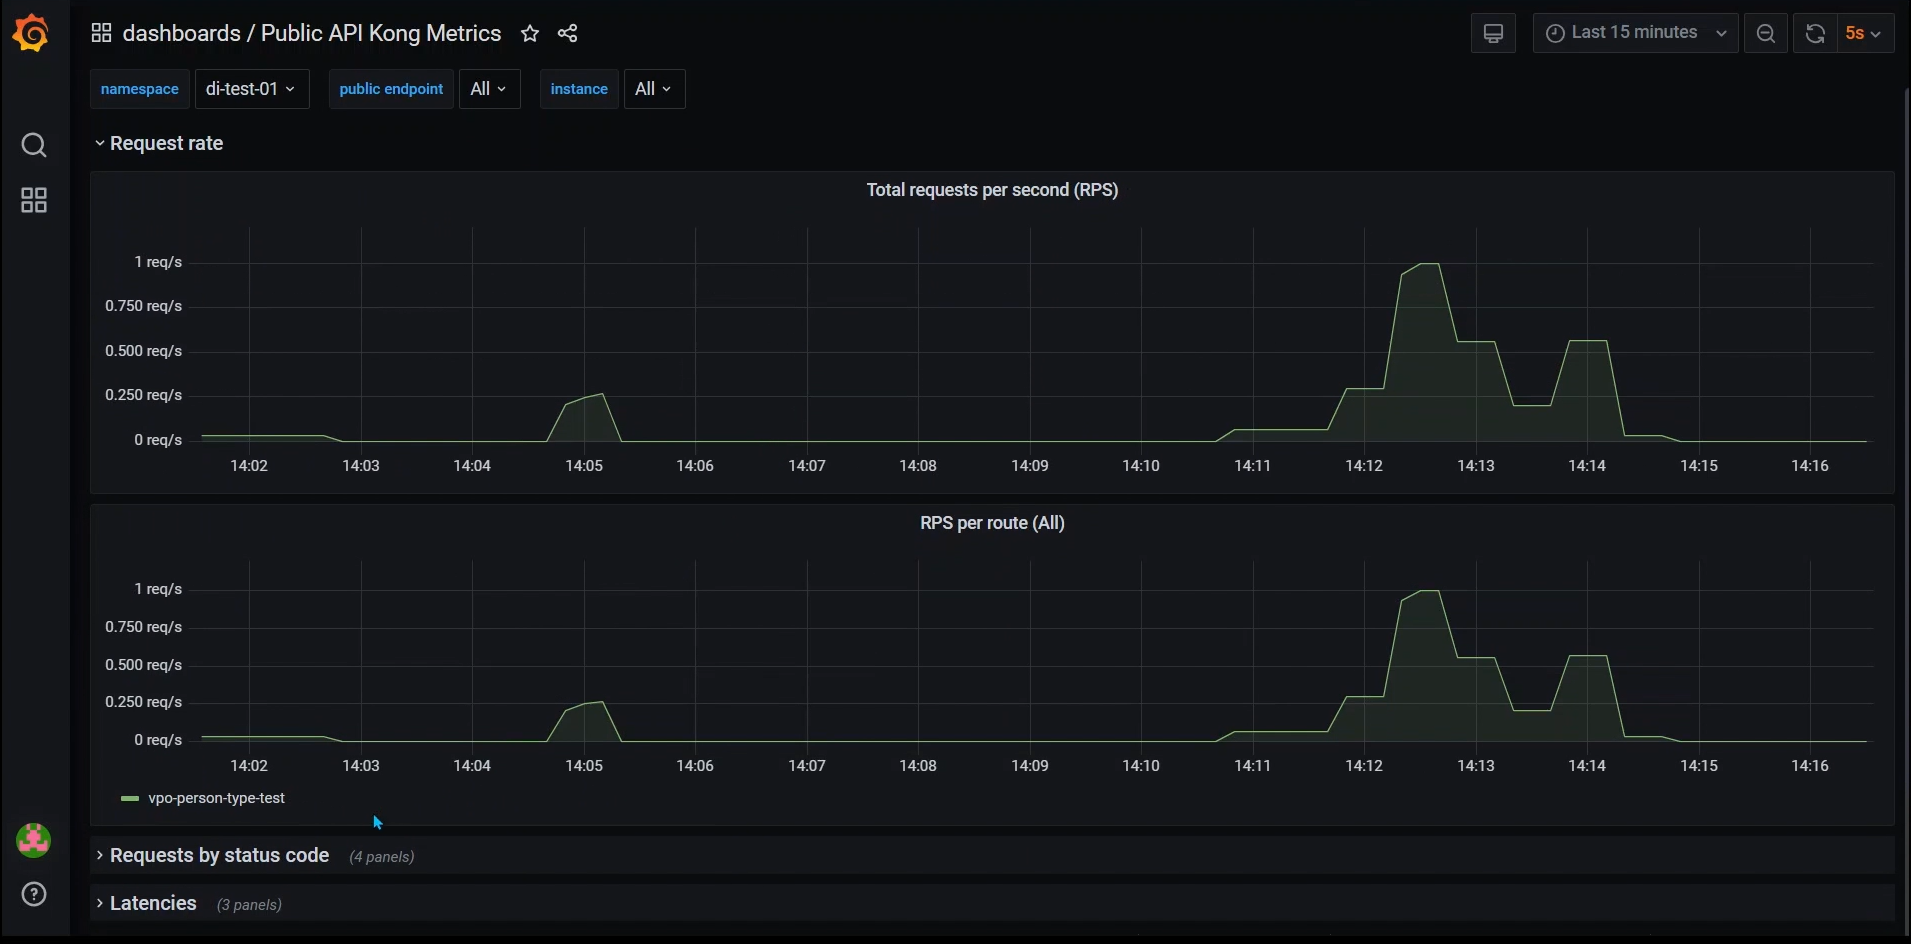
3. Viewing dashboard metrics
For monitoring the performance and tracking requests to your API, utilize the metrics dashboard. Continuously monitoring these metrics will help you identify potential API performance issues and address them timely.
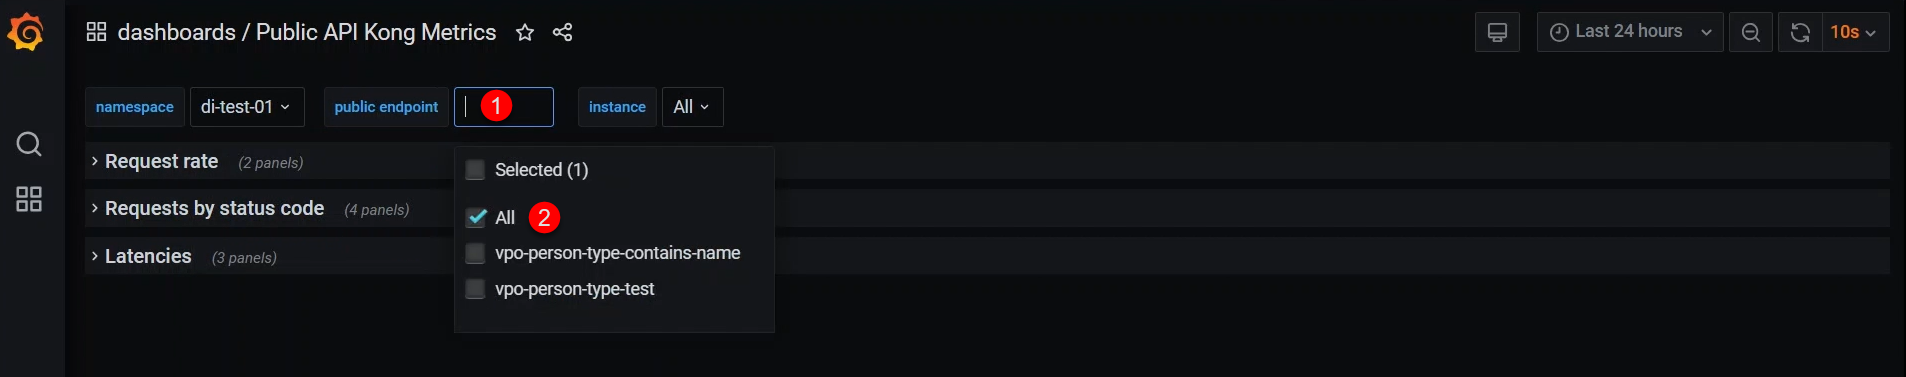
Select the public endpoint for which you want to view metrics. This can be done in the public endpoint section. Choose either all the created points or specific ones.
-
The Request rate section shows the number of requests for each integration point.
-
Total requests per second (RPS) displays the overall volume of API requests per second.
-
RPS per route analyzes the volume of requests for each route individually.
-
-
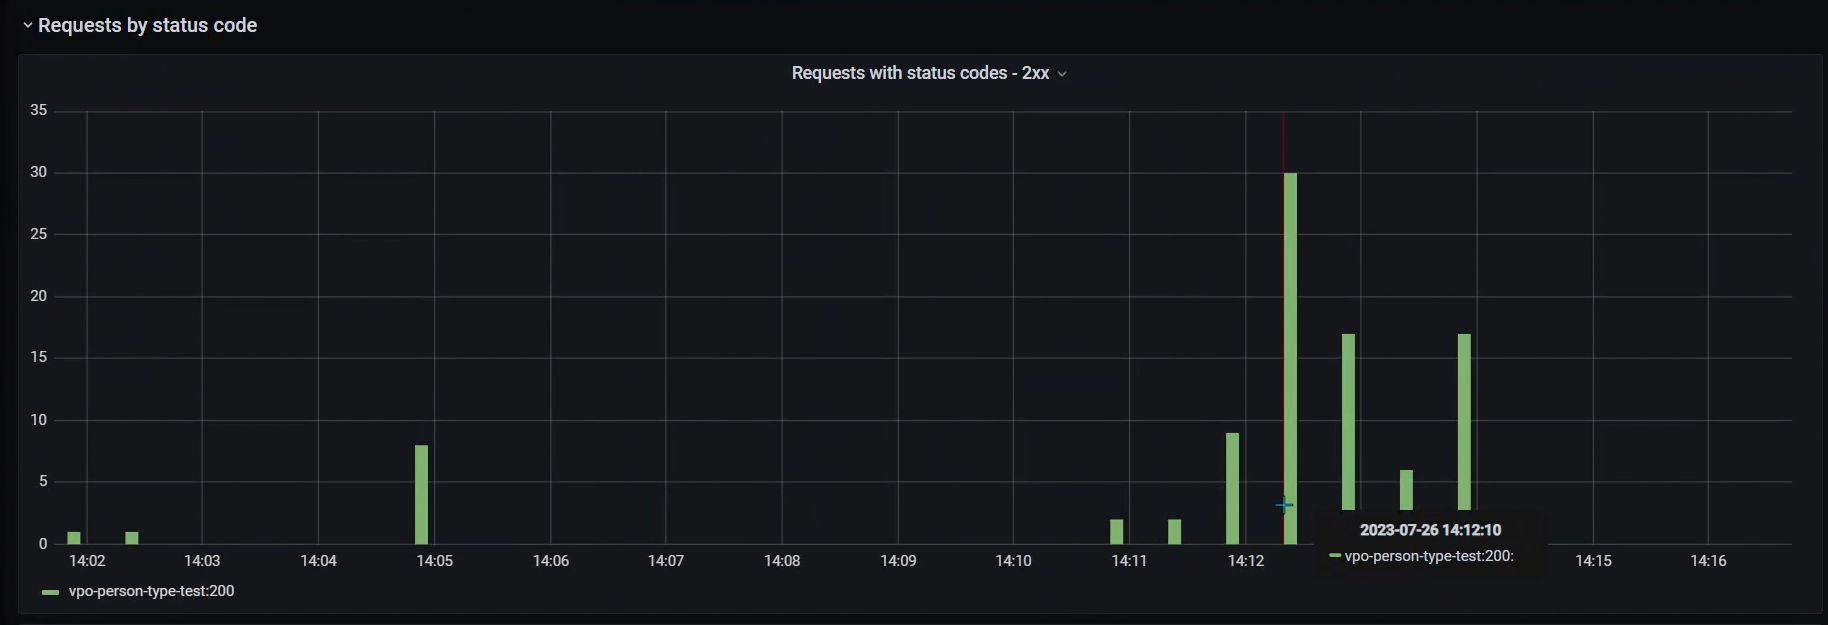
The Requests by status code sections (2xx, 4xx, 5xx, and other) present statistics on successful requests, client errors, server errors, and other response codes.
-
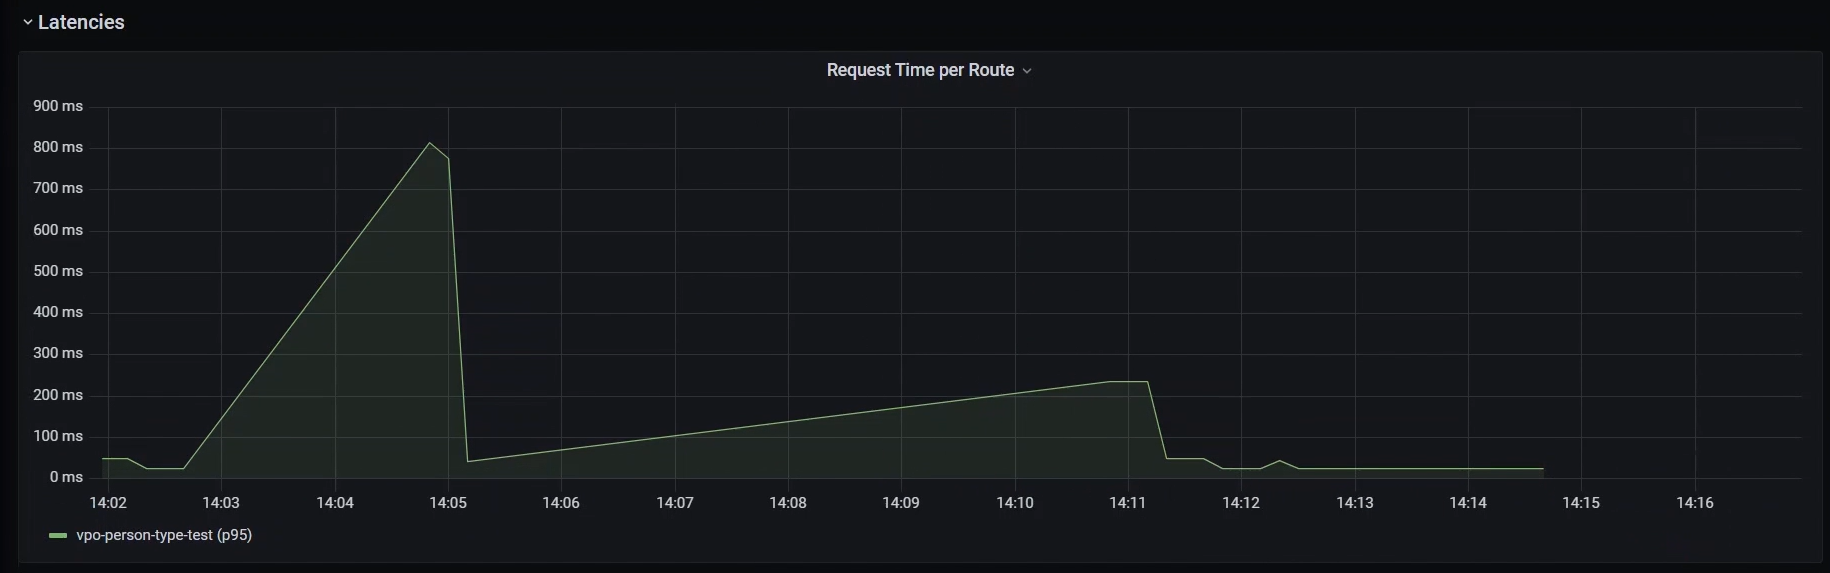
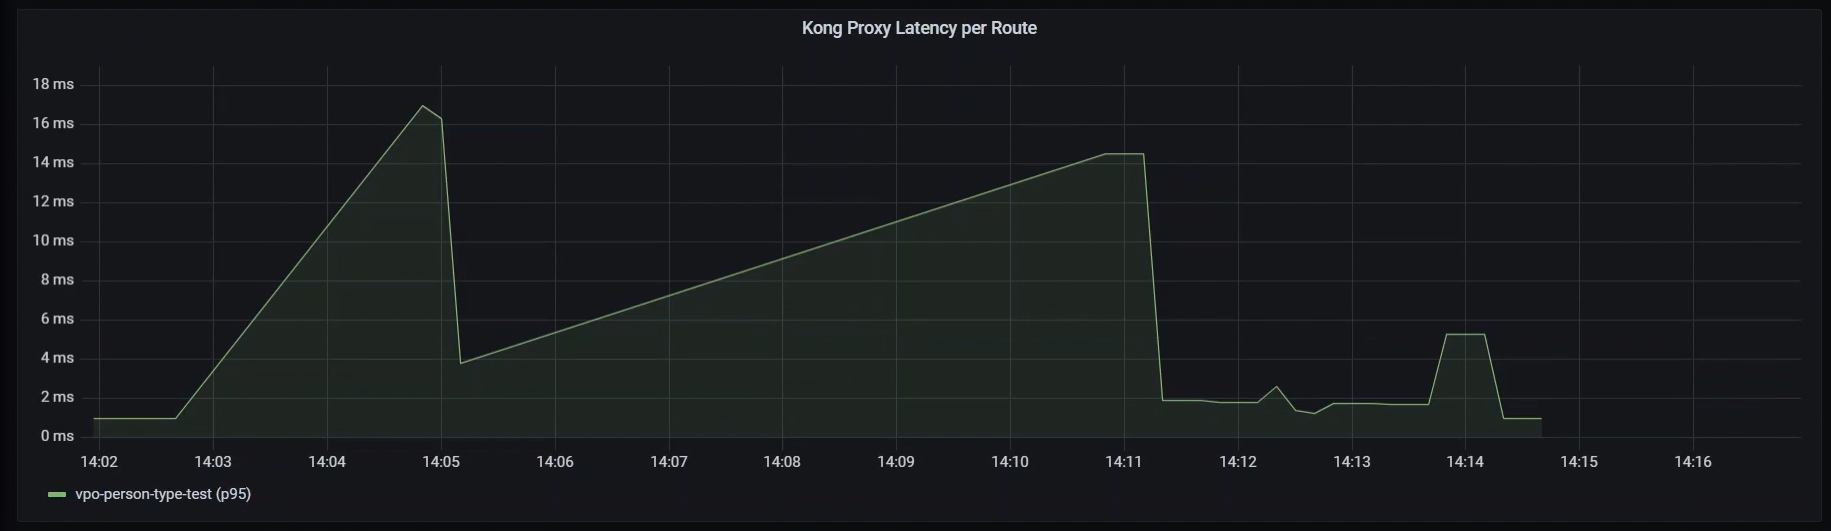
The Latencies section indicates the server’s response time to requests.
-
Request time per route denotes the average server response time for each route.
-
Kong Proxy latency per route reflects the delay between the server receiving a request and sending its response.
-
Upstream time across per route determines the time the server takes to process the request and receive a response from the upstream service.
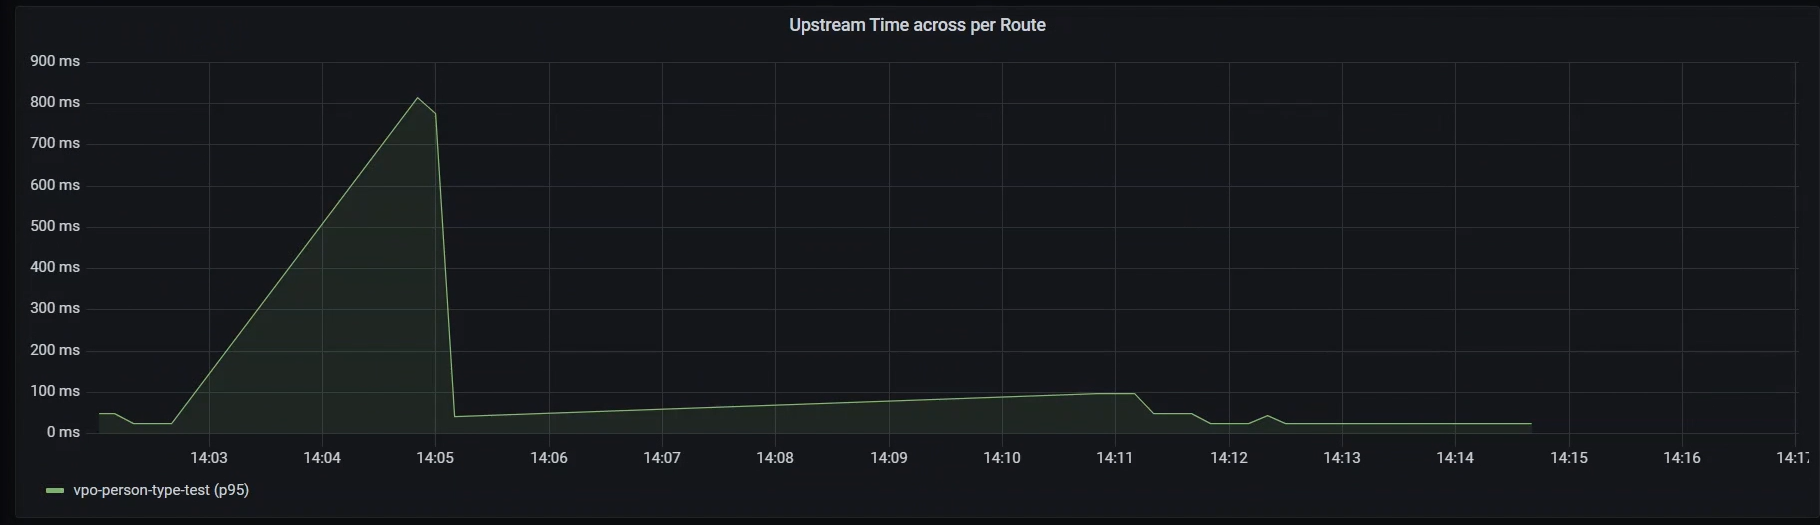
-