Quick links to registry services
- 1. Overview
- 2. Service groups
- 2.1. Registry administrative zone
- Regulations administrator portal (admin portal)
- Regulations changes review and storage service (Gerrit)
- Regulations deployment service (Jenkins)
- API documentation of the registry data management service (Swagger)
- Reports modeling service (Redash Admin)
- Business Process Administration Portal
- Registry data viewing service (pgAdmin)
- Geodata management service (GeoServer UI)
- Registry artifacts repository (Nexus)
- 2.2. Registry operational zone
- 2.3. Platform administrative zone
- 2.4. Platform operational zone
- 2.1. Registry administrative zone
- 3. Services with restricted access
- 4. Disabled services
1. Overview
The Control Plane admin console provides registry administrators with a convenient way to access all the essential web services from one place. In this article, we will go over the main aspects of this feature.
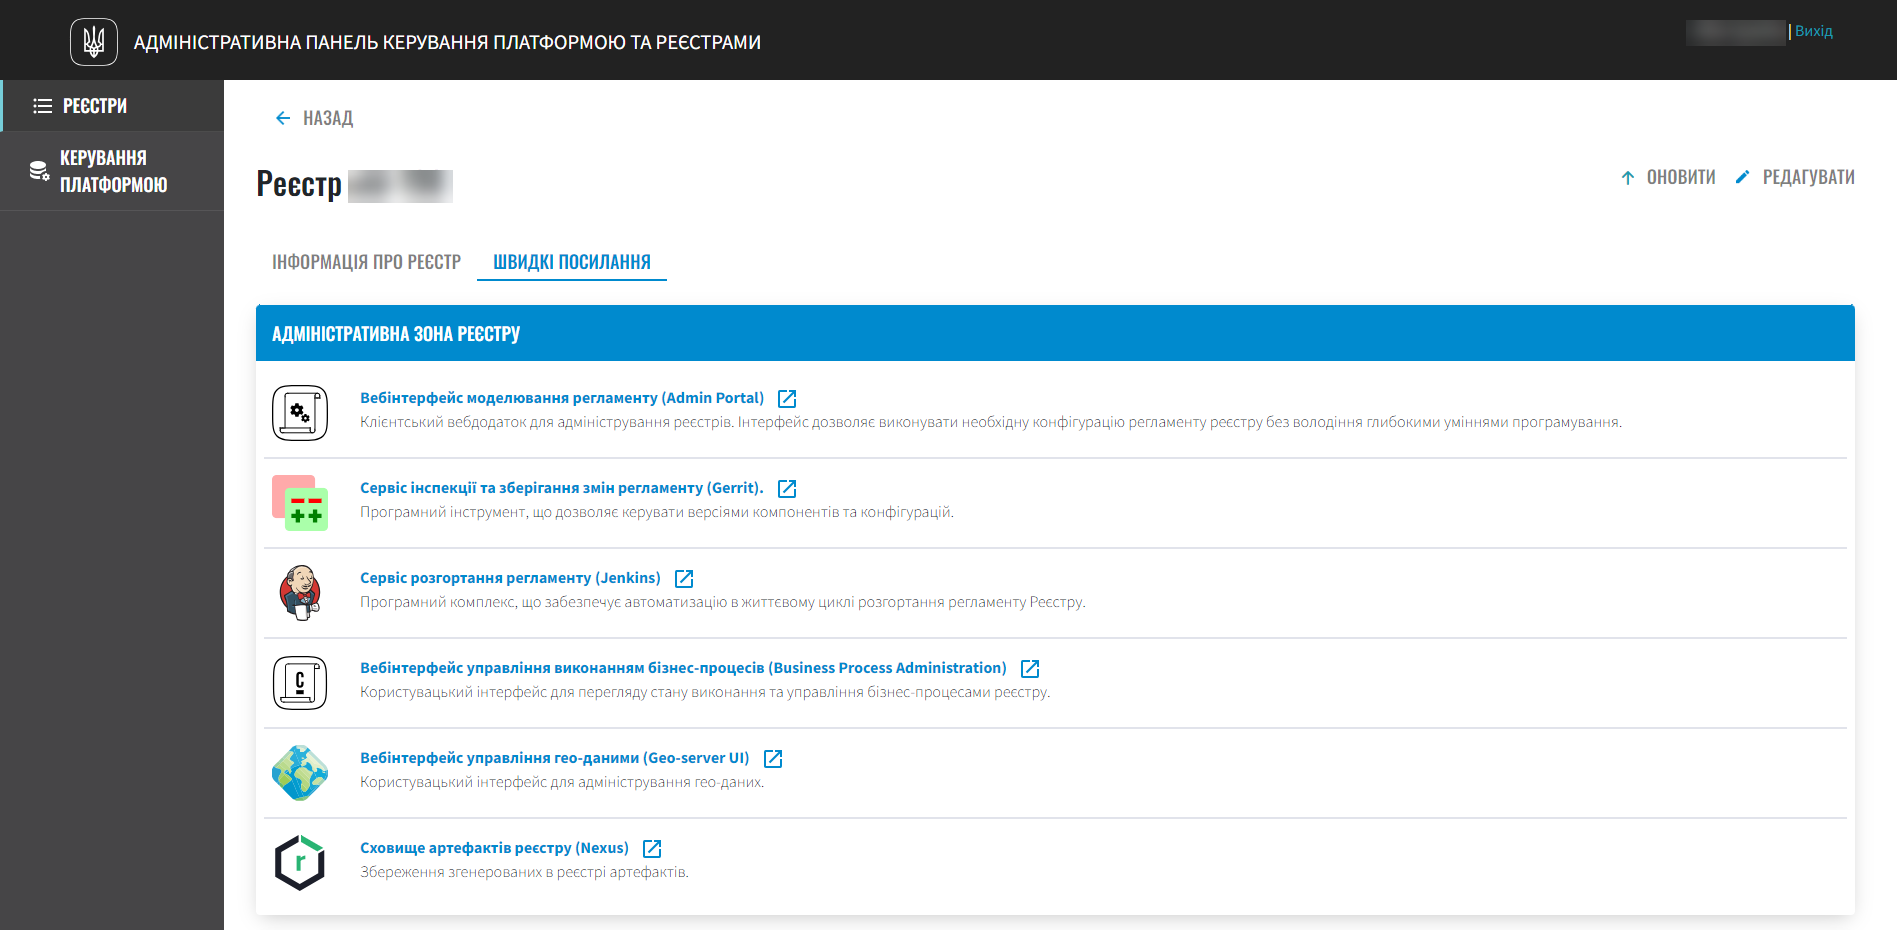
When you open any registry in the Registries section, note the Quick links tab. This is where you will find links to the web interfaces of the various services with brief descriptions.
|
To learn more about each service, search the documentation using the name of the service as a query. |
2. Service groups
- Services are divided into four groups:
Groups are sorted from most to least used, same as links within each group.
|
Links to services may vary depending on the registry environment and the Platform cluster where a particular service is deployed.
|
2.1. Registry administrative zone
Regulations administrator portal (admin portal)
- Purpose:
-
A web application for registry administrators. Its interface allows configuring registry regulations without advanced programming skills.
Regulations changes review and storage service (Gerrit)
- Purpose:
-
A version control tool for components and configurations.
Regulations deployment service (Jenkins)
- Purpose:
-
A software complex that enables automation in the lifecycle of registry regulations deployment.
API documentation of the registry data management service (Swagger)
- Purpose:
-
A web interface for viewing the API endpoints and documentation generated for the registry data management subsystem. These endpoints are used by standard integration connectors when building interactions in business processes.
Be sure to add /openapito the end of the link, otherwise you will end up in the Swagger sandbox, or test environment.
Reports modeling service (Redash Admin)
- Purpose:
-
A web interface for creating and configuring analytical reports and dashboards.
Business Process Administration Portal
- Purpose:
-
A web interface for monitoring and managing the registry’s business processes.
Registry data viewing service (pgAdmin)
- Purpose:
-
A web interface for viewing registry data and data model schema.
Geodata management service (GeoServer UI)
- Purpose:
-
A web interface for managing geographic data.
Registry artifacts repository (Nexus)
- Purpose:
-
A service for storing registry artifacts.
2.2. Registry operational zone
Service recipient portal (citizen portal)
- Purpose:
-
A web application through which citizens can receive administrative and information services.
Service provider portal (officer portal)
- Purpose:
-
A web application through which officers can provide administrative and information services.
2.3. Platform administrative zone
OpenShift cluster management console
- Purpose:
-
A user interface accessible from a web browser. Platform administrators can use the OpenShift web console to view and manage the content and resources of the OpenShift cluster, Platform, and registries.
Configuration changes review and storage service (Gerrit)
- Purpose:
-
A version control tool for components and configurations. Gerrit is tightly integrated with the Git distributed version control system. With this tool, Platform administrators can review all code and configuration changes and approve or reject them using a web browser.
Configuration deployment service (Jenkins)
- Purpose:
-
A software complex that enables automation in the lifecycle of the Platform and registries. Jenkins performs registry deployment, configuration, updates, and many other automated tasks on the Platform.
2.4. Platform operational zone
User and role management service (Keycloak)
- Purpose:
-
A service for user authentication and authorization.
Platform event log viewer (Kibana)
- Purpose:
-
A web interface for accessing and viewing Platform logs.
| Platform logging services are deployed in a separate openshift-logging project. |
Platform monitoring service (Grafana)
- Purpose:
-
A web interface for accessing and viewing monitoring data.
| Platform events monitoring services are deployed in a separate grafana-monitoring project. |
Service mesh management and monitoring (Kiali)
- Purpose:
-
A web interface for configuring, checking, and analyzing the Platform service mesh, as well as visualizing the traffic inside the Platform.
What is a service mesh?
A service mesh is an architectural approach in distributed systems that simplifies interaction between microservices and helps them work together more efficiently. Service mesh adds a transparent infrastructure that facilitates communication between services and manages traffic, security, monitoring, and other aspects of how microservices work.
Request monitoring and tracing service (Jaeger)
- Purpose:
-
A tool for monitoring and troubleshooting microservices-based distributed systems. Jaeger can be used for component dependency analysis, fault analysis, transaction monitoring, and Platform performance optimization.
3. Services with restricted access
If some components are not available in the currently configured registry profile, their links are not displayed. For example, if GeoServer is not deployed, its link will be missing (to learn more about the geomodule, see Working with geodata in the registry).
4. Disabled services
If certain services are disabled, such as the admin or user portals, then a Disabled status is displayed instead of a link.