Monitoring business process execution metrics
| 🌐 This document is available in both English and Ukrainian. Use the language toggle in the top right corner to switch between versions. |
1. Overview
A registry technical administrator can monitor business process metrics via Grafana web-interface. Administrators and developers can monitor the key metrics and use this info to identify and correct possible issues, and increase system productivity.
- The main points of monitoring include:
-
-
Access to the dedicated Camunda Metrics dashboard: the technical administrator gets access to a dashboard with a defined list of metrics — Camunda Metrics.
-
Selection of the registry project: if the administrator has access to multiple registries, they can specify a project (namespace) of a registry, which they need metrics for.
-
2. Metrics setup and configuration
The procedure of registry updating automatically provides the following abilities:
-
Metrics registration is enabled by default: this means that the system automatically registers and monitors important execution metrics, such as productivity, load, response time, and other info on system state.
-
Configuring gathering and storing of metrics in Prometheus: the system automatically configures the gathering and storing of metrics in Prometheus, ensuring continuous access to this data for analysis and optimization.
-
Setup and configuration of Grafana dashboard: setting up and configuring Grafana dashboard allows the administrators to visualize the metrics, monitor live changes and get notifications about possible problems or anomalies. This way it’s easier to work with the metrics and react to any changes in the system.
3. Dashboard general view
To view the dashboard, take the following steps:
-
Navigate to the administrator panel Control Plane.
-
Select your registry >
Edit> Quick linksSee more info on quick links here: Quick links to registry services. -
Follow the link to Grafana monitoring Platform web-interface.
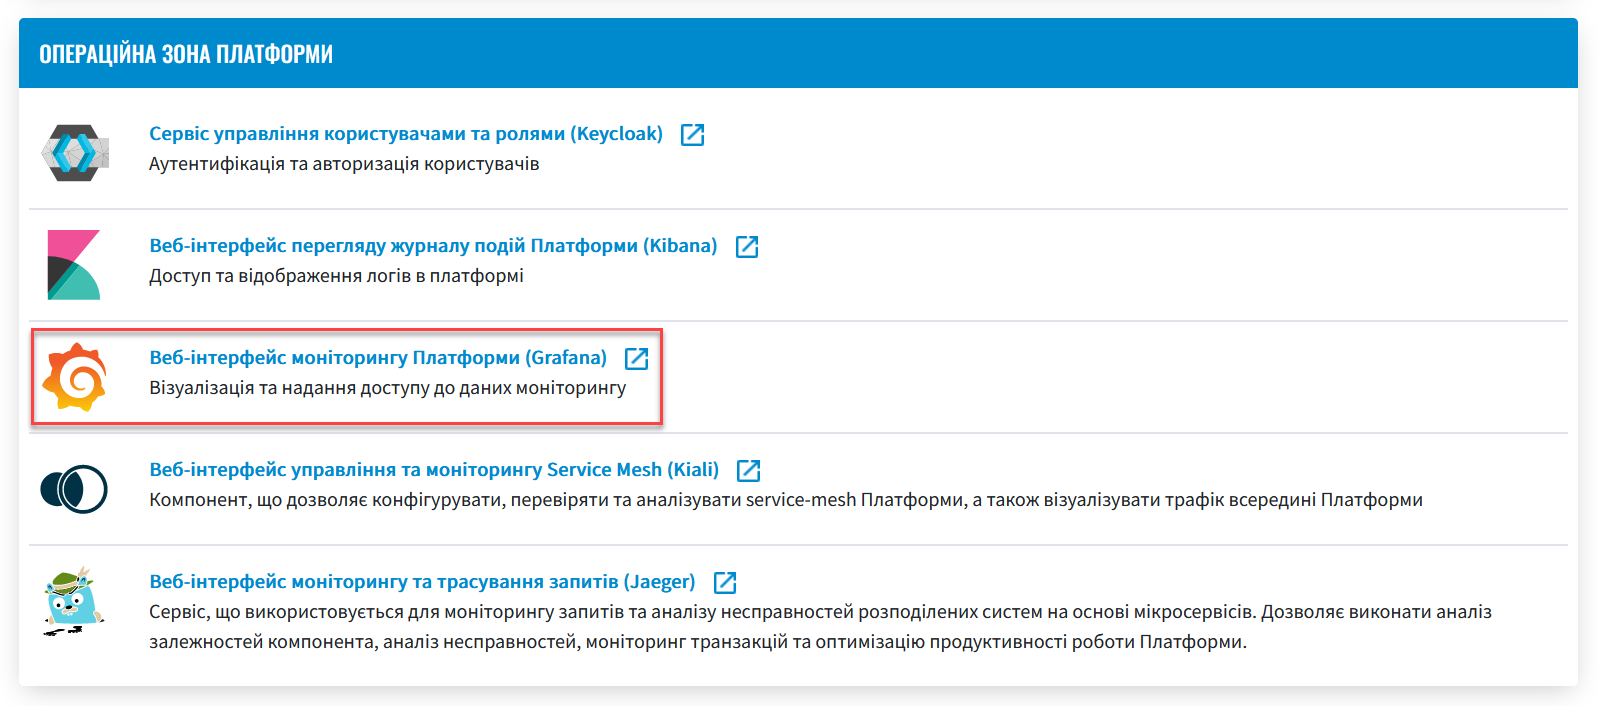
-
Sign in using the
Sign in with OAuthoption.
-
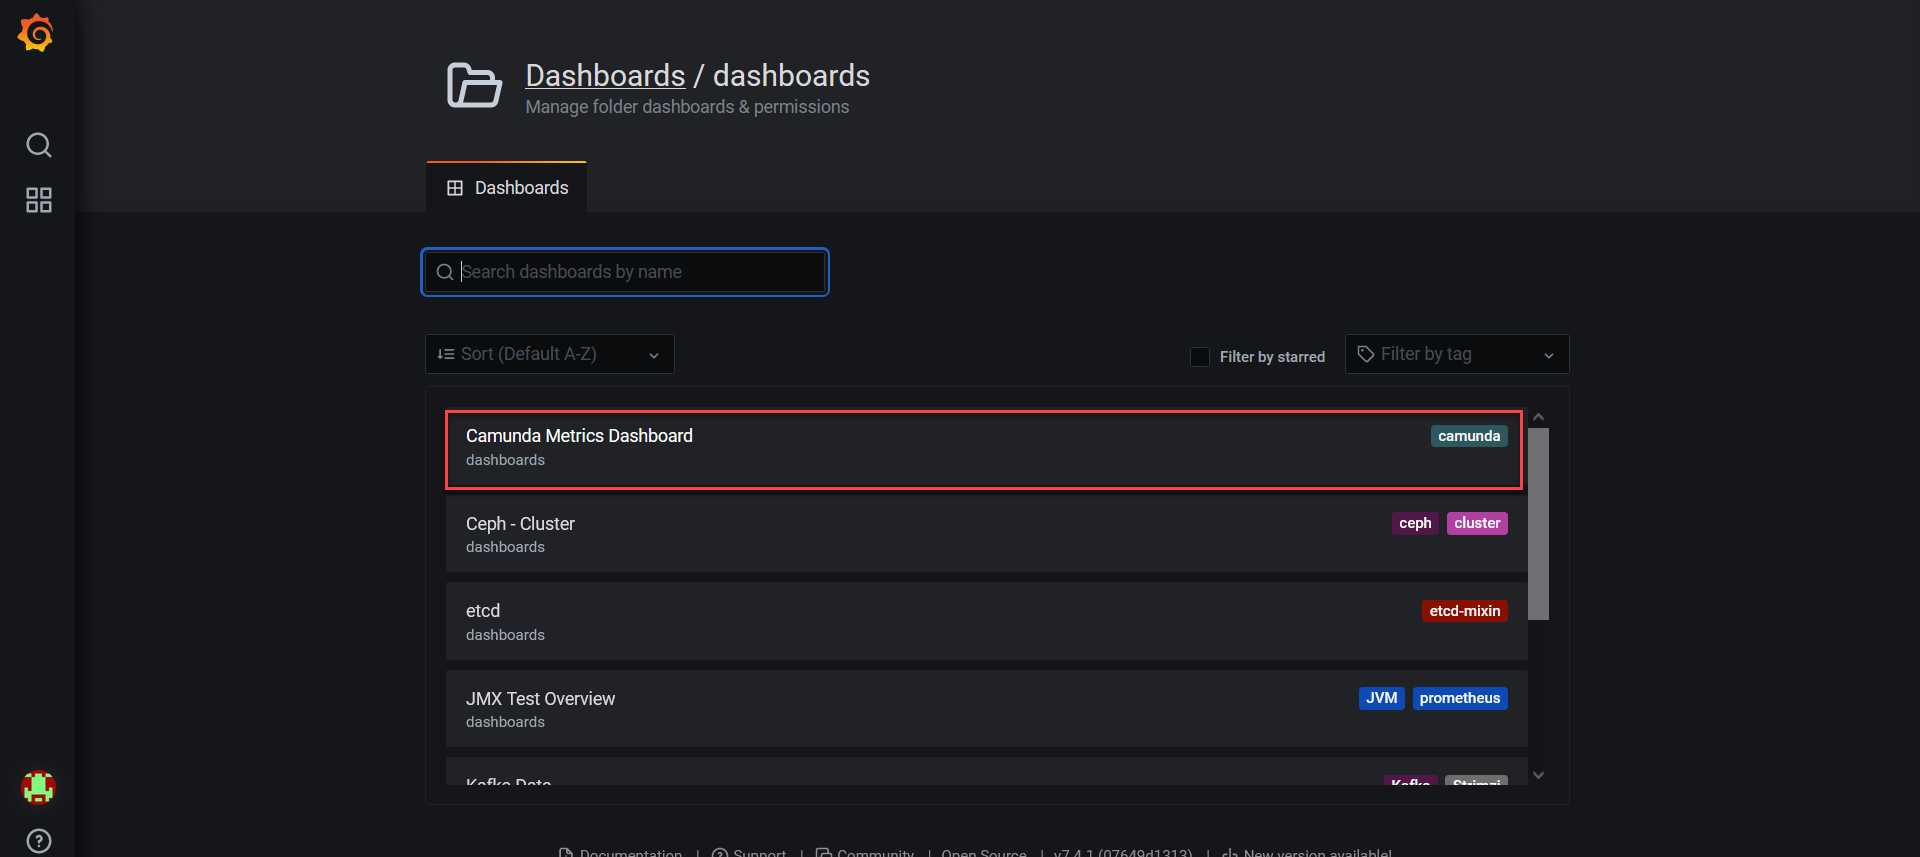
On the left side panel, select Manage > Dashboards > Go to folder.
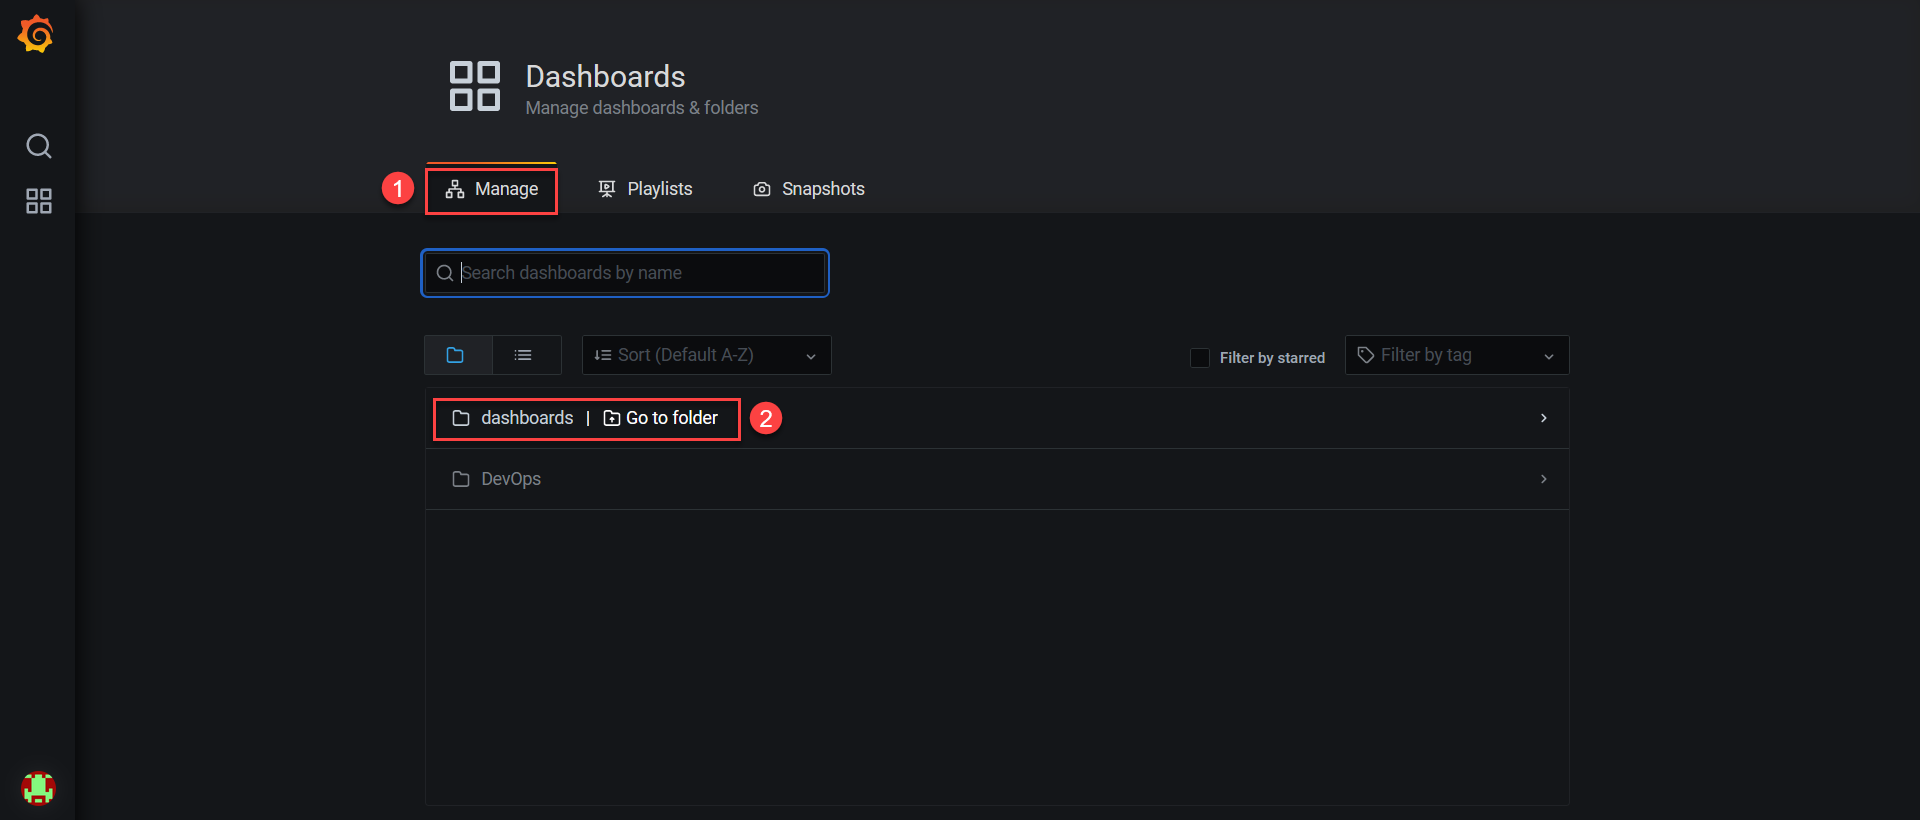
-
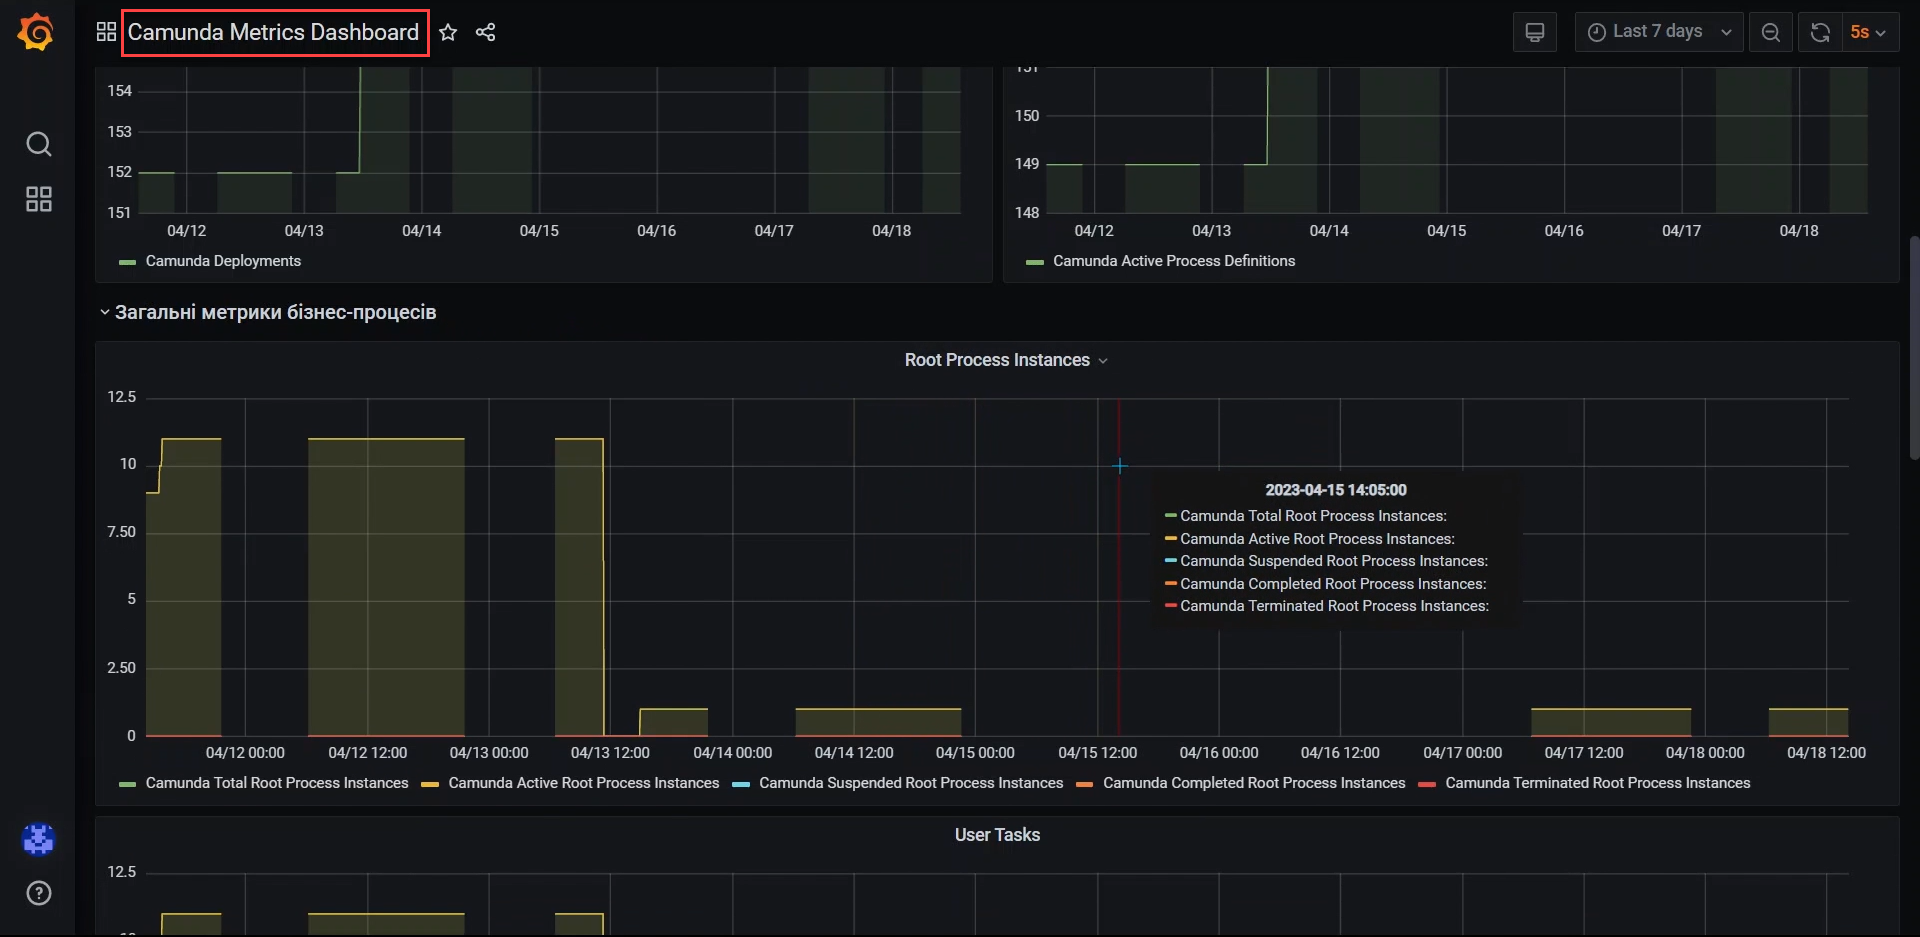
Open the Camunda Metrics Dashboard.
Тут ви можете ознайомитися із групами метрик, представленими на дашборді.
Camunda Metrics are differentiated by several groups, which are described later in this document.
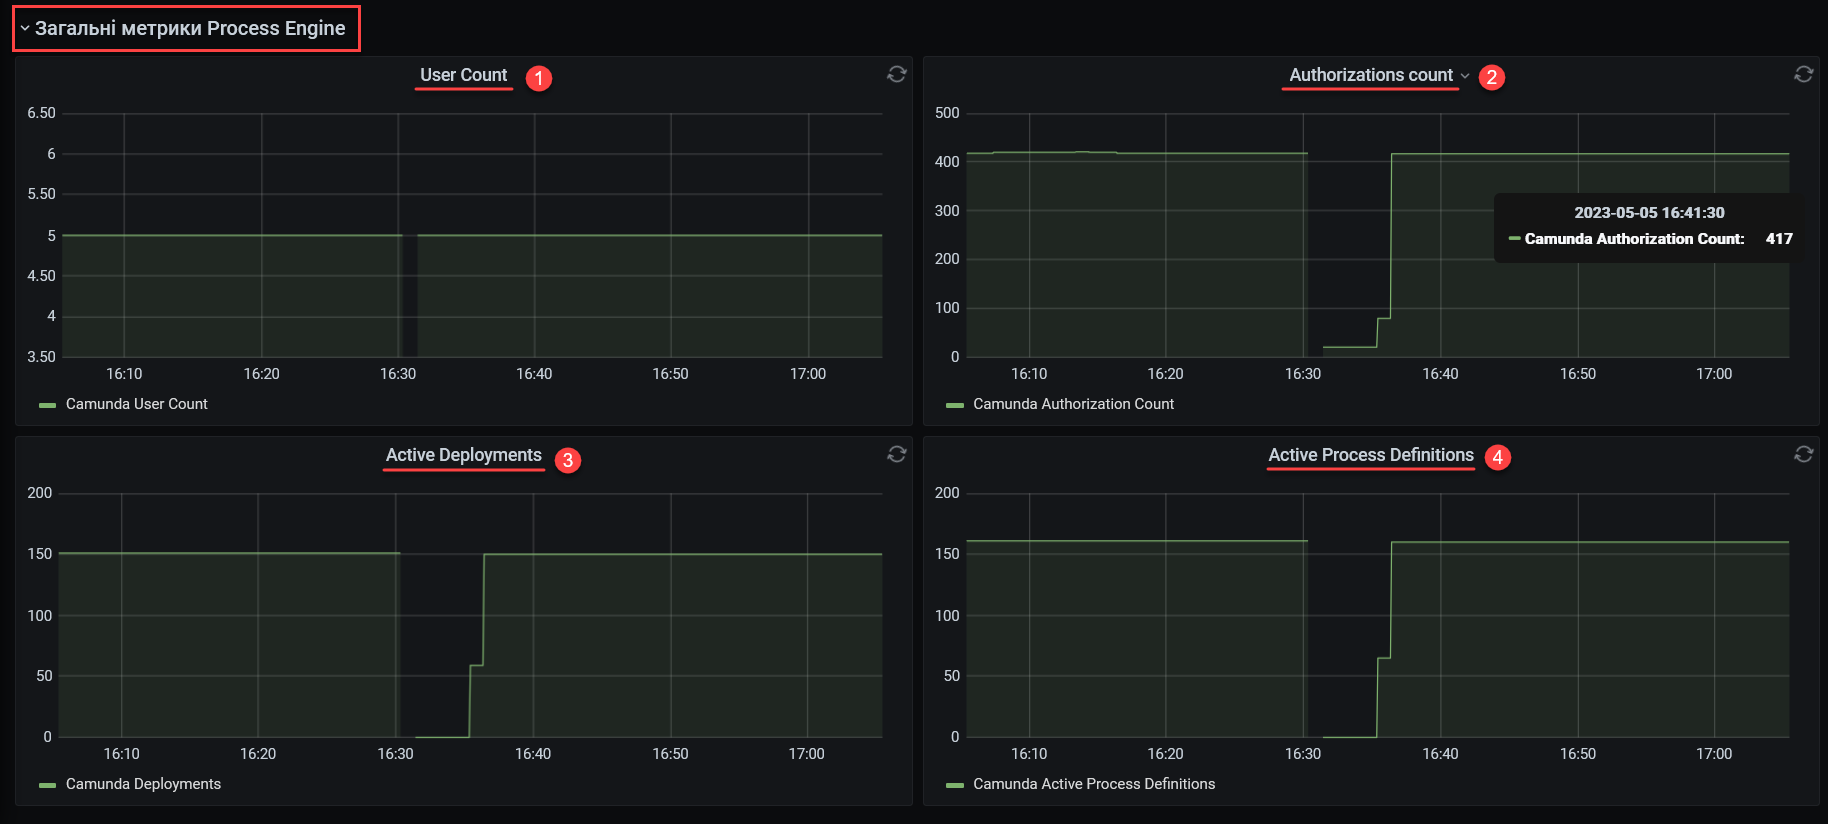
3.1. Process Engine general metrics
Process Engine general metrics provide important information about the state and functioning of the Process Engine, allowing the administrators to control and optimize system operation.
- These metrics include the following indicators:
-
-
User count: shows the general number of registered users in the system.
-
Authorization count: shows the number of rights for different actions granted to users of user groups.
-
Active deployments: shows the number of current process deployments in the system.
-
Active process definitions: shows the number of unique business process definitions currently active in the system.
What is Active process definition?
Active process definition means that the process may not be running yet, but is available for new instance deployment. Starting a process from the Active process definition state will deploy a new instance.
-
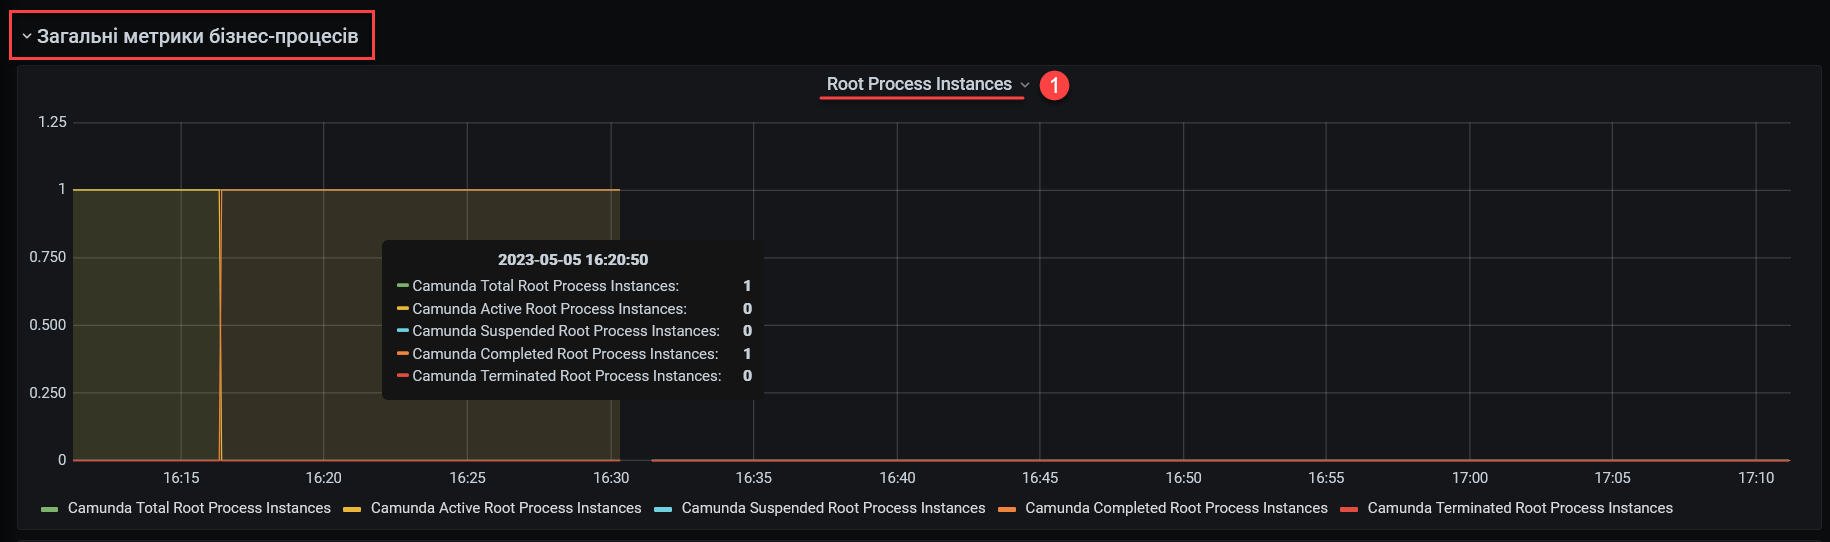
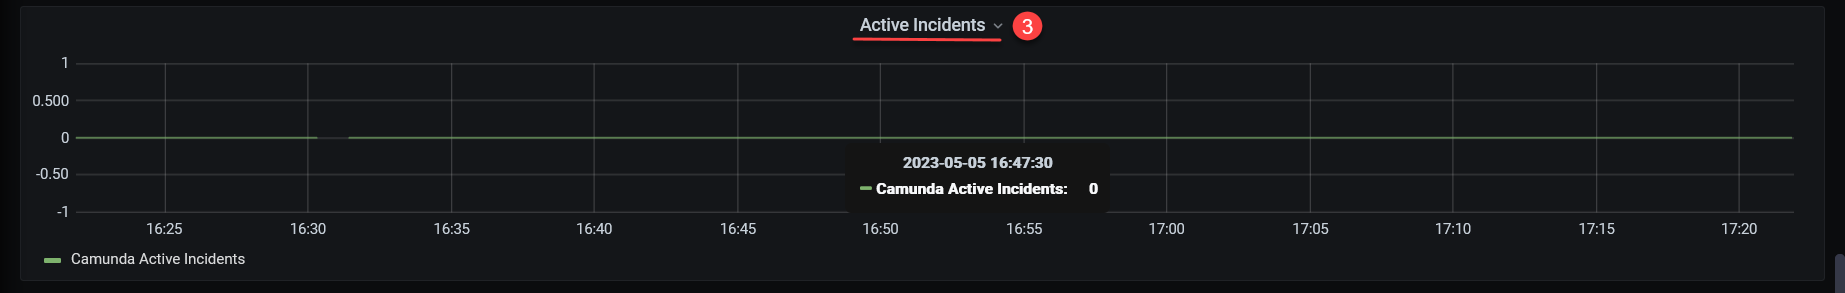
3.2. Business process general metrics
Business process general metrics show the statistics on starting, executing and completing business processes.
- These metrics include the following indicators:
-
-
Root Process Instances: the main process instances that represent certain business process use cases in Camunda. They differ from subprocesses that deploy within other processes.
-
Camunda Total Root Process Instances: shows the general number of the created main process instances, including active, suspended, completed and terminated.
-
Camunda Active Root Process Instances: shows the number of main process instances, which are currently active and running in the system.
-
Camunda Suspended Root Process Instances: shows the number of main process instances, which were suspended and aren’t currently running.
-
Camunda Completed Root Process Instances: shows the number of successfully completed main process instances.
-
Camunda Terminated Root Process Instances: shows the number of main process instances terminated before completion, usually due to unplanned situations or administrator actions.
-
-
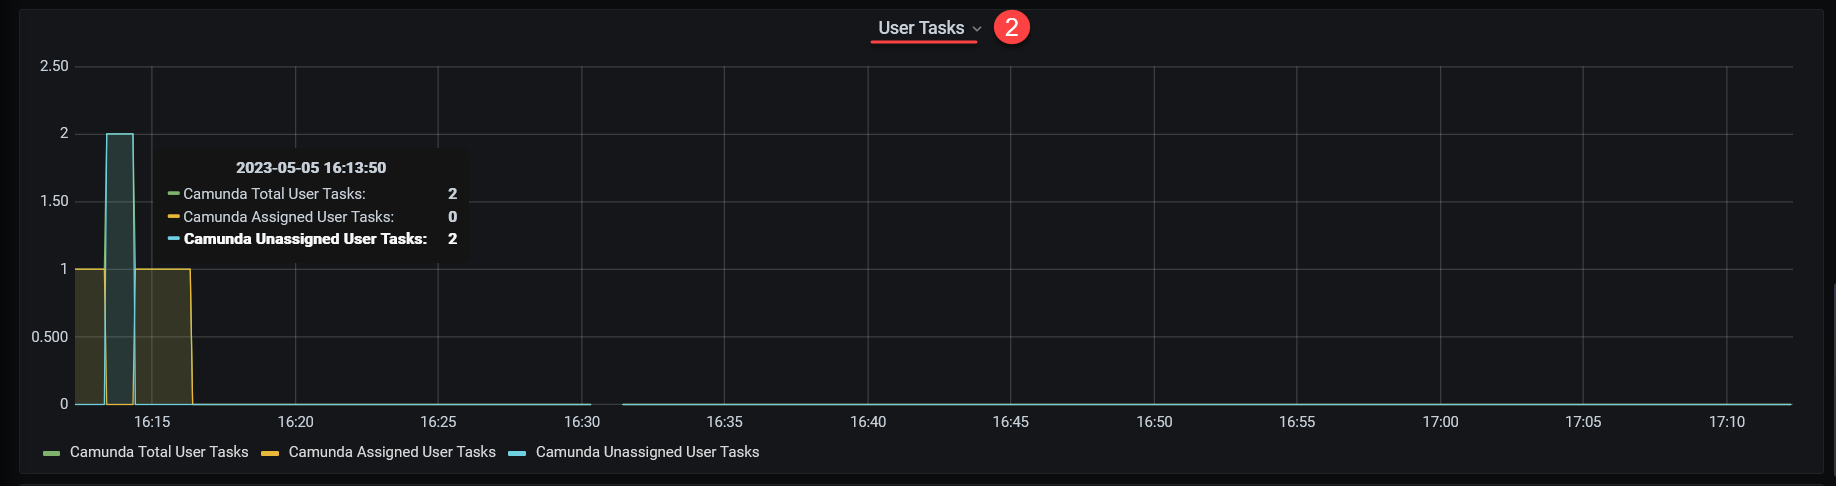
User Tasks: user tasks that user interaction during business process execution. They allow the administrators to monitor user workload and control decision making.
-
Camunda Total User Tasks: shows the general amount of user tasks created within all the processes.
-
Camunda Assigned User Tasks: shows the general amount of user tasks assigned to users or user groups.
-
Camunda Unassigned User Tasks: shows the general amount of user tasks not assigned to a user or user group. These tasks may be assigned later or resolved using automatic rules.x
-
-
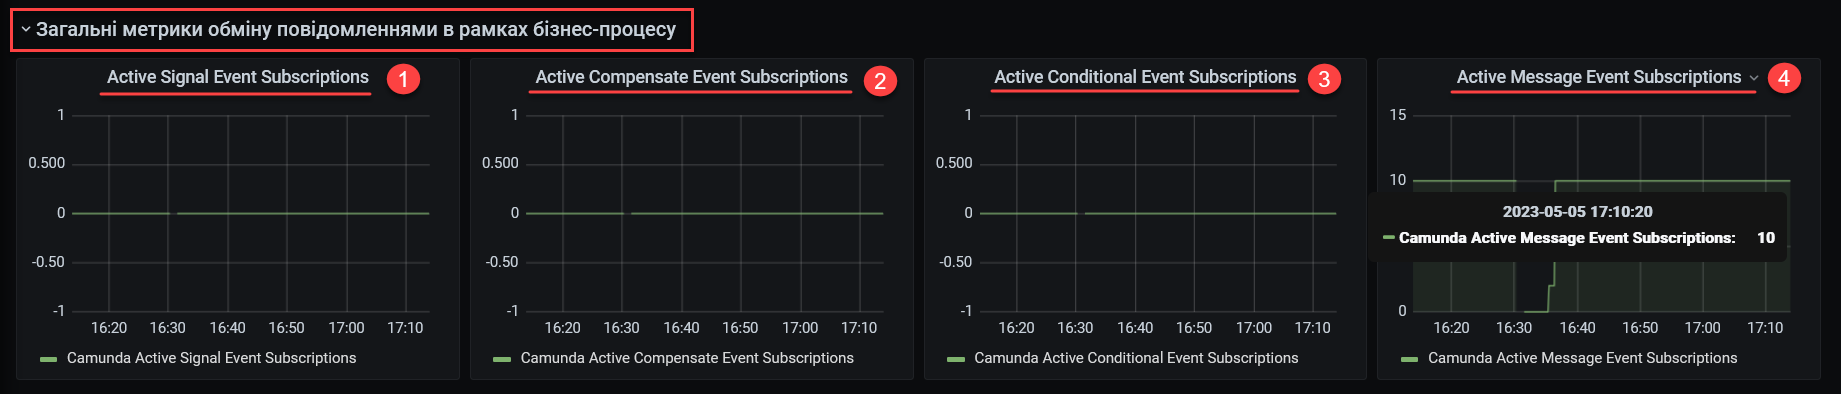
3.3. General metrics of message exchange within a business process
General metrics of message exchange within a business process: these metrics show information about message exchange in a certain business process, including active event subscriptions and message processing.
- These metrics include the following indicators:
-
-
Active Signal Event Subscriptions: shows the number of active subscriptions for signal events used to coordinate between different processes or different elements within a single process.
-
Active Compensate Event Subscriptions: shows the number of active subscriptions for compensate events used to revert actions in a process in case of unplanned cases.
-
Active Conditional Event Subscriptions: shows the number of active subscriptions for conditional events used to react on changes of process state, or external factors.
-
Active Message Event Subscriptions: shows the number of active subscriptions for message events that allow for the exchange of messages between different processes and components.
-
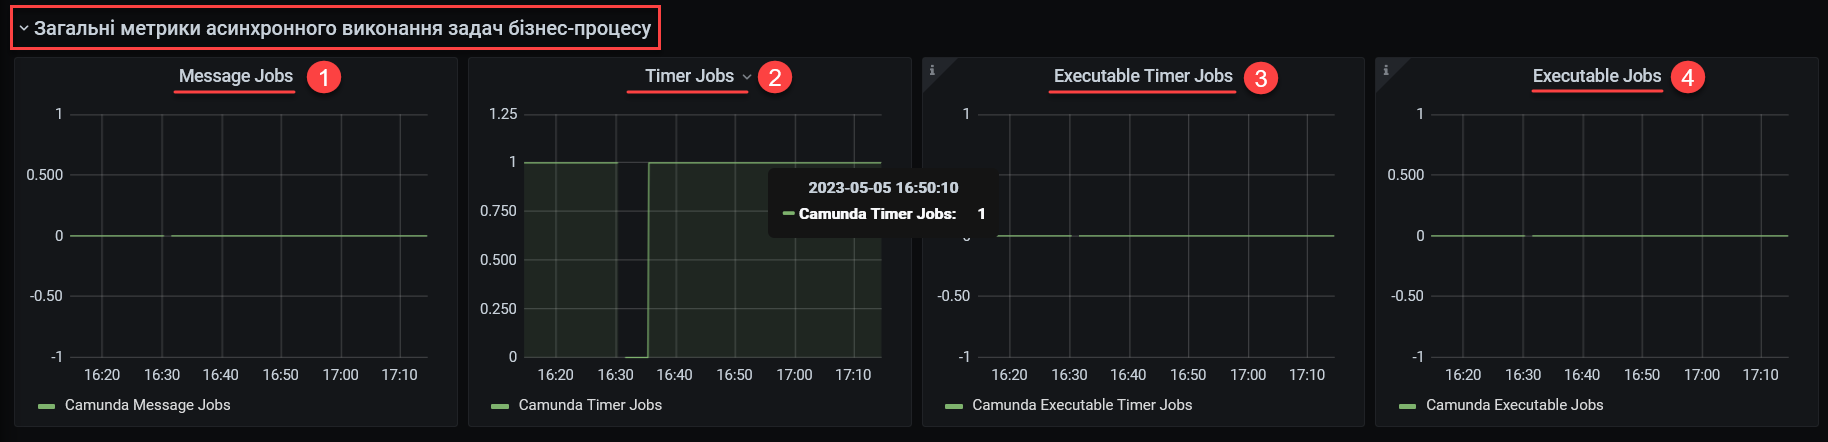
3.4. General metrics of asynchronous business process task execution
General metrics of asynchronous business process task execution: provide statistics of asynchronous task execution, like the number of active, timed and executed jobs.
- These metrics include the following indicators:
-
-
Message Jobs: shows the number of active and timed tasks, associated with message processing in a business process.
-
Timer Jobs: shows the number of active and timed tasks, associated with timers used to control time periods and other time restrictions in a business process.
-
Executable Timer Jobs: a specific category of jobs that utilize timers and are ready for execution or are waiting for a free worker thread for their execution. They can be used to control time intervals and other time constraints within business processes.
-
Executable Jobs: shows the number of tasks ready for execution, or awaiting a free workflow for execution.
-
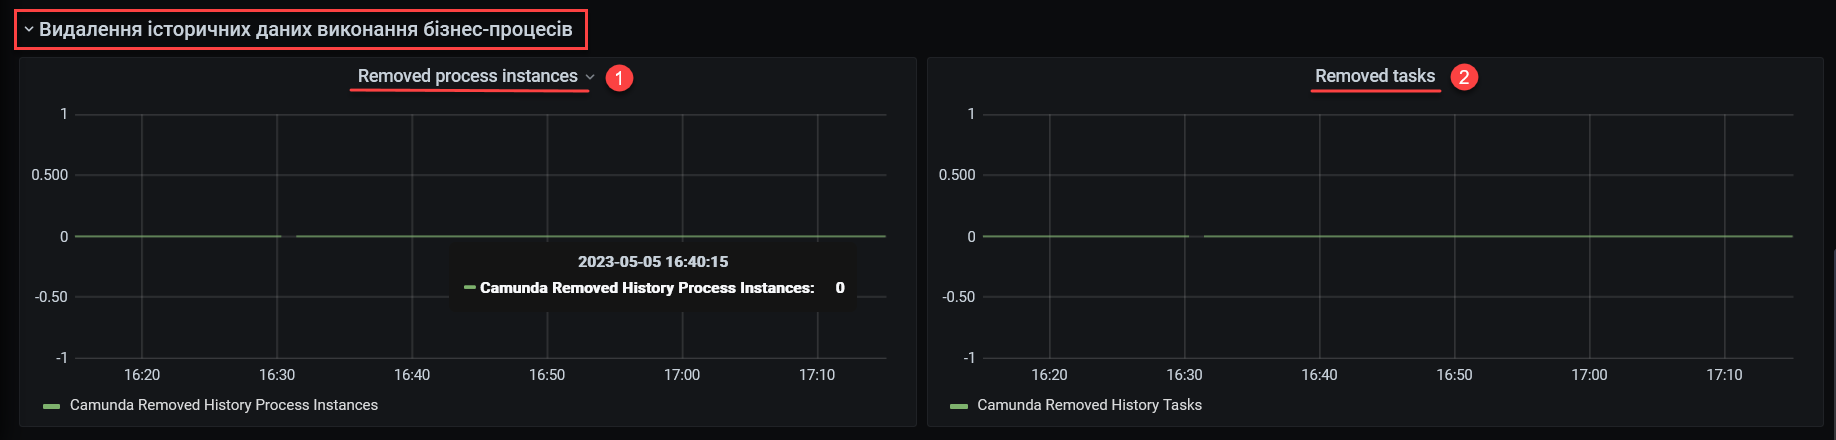
3.5. Deleting business process execution historical data
The deletion of business process execution historical data: contains metrics associated with the deletion of business process historical data for system resource optimization.
- These metrics include the following indicators:
-
-
Removed process instances: shows the number of deleted historical business process instances within the system. It allows for optimal resource usage, improving the productivity and reducing system workload.
-
Removed tasks: shows the number of removed historical tasks within business processes. The deletion of historical tasks also improves the resource usage and system operation stability, because it reduces database and other components' workload.
-