Analytical reporting
| 🌐 This document is available in both English and Ukrainian. Use the language toggle in the top right corner to switch between versions. |
|
For details, see the Developing analytical reports tutorial, which goes over the main aspects of developing and viewing analytical reports from scratch. |
1. Overview
The Platform’s analytical reporting is based on the advanced capabilities of the Redash service. This tool enables you to easily connect to various data sources, build and share queries, and effectively visualize the results.
Thanks to Redash, Platform users can create graphs, tables, and other visualizations, as well as develop analytical data representations. It promotes teamwork by providing quick access to key business metrics and analytics.

Regulations developers can create layers of analytical data, provide access to these representations, build queries directly in the Redash service, and model dashboards based on those queries. These reports then become available in the user portals via individual services.
|
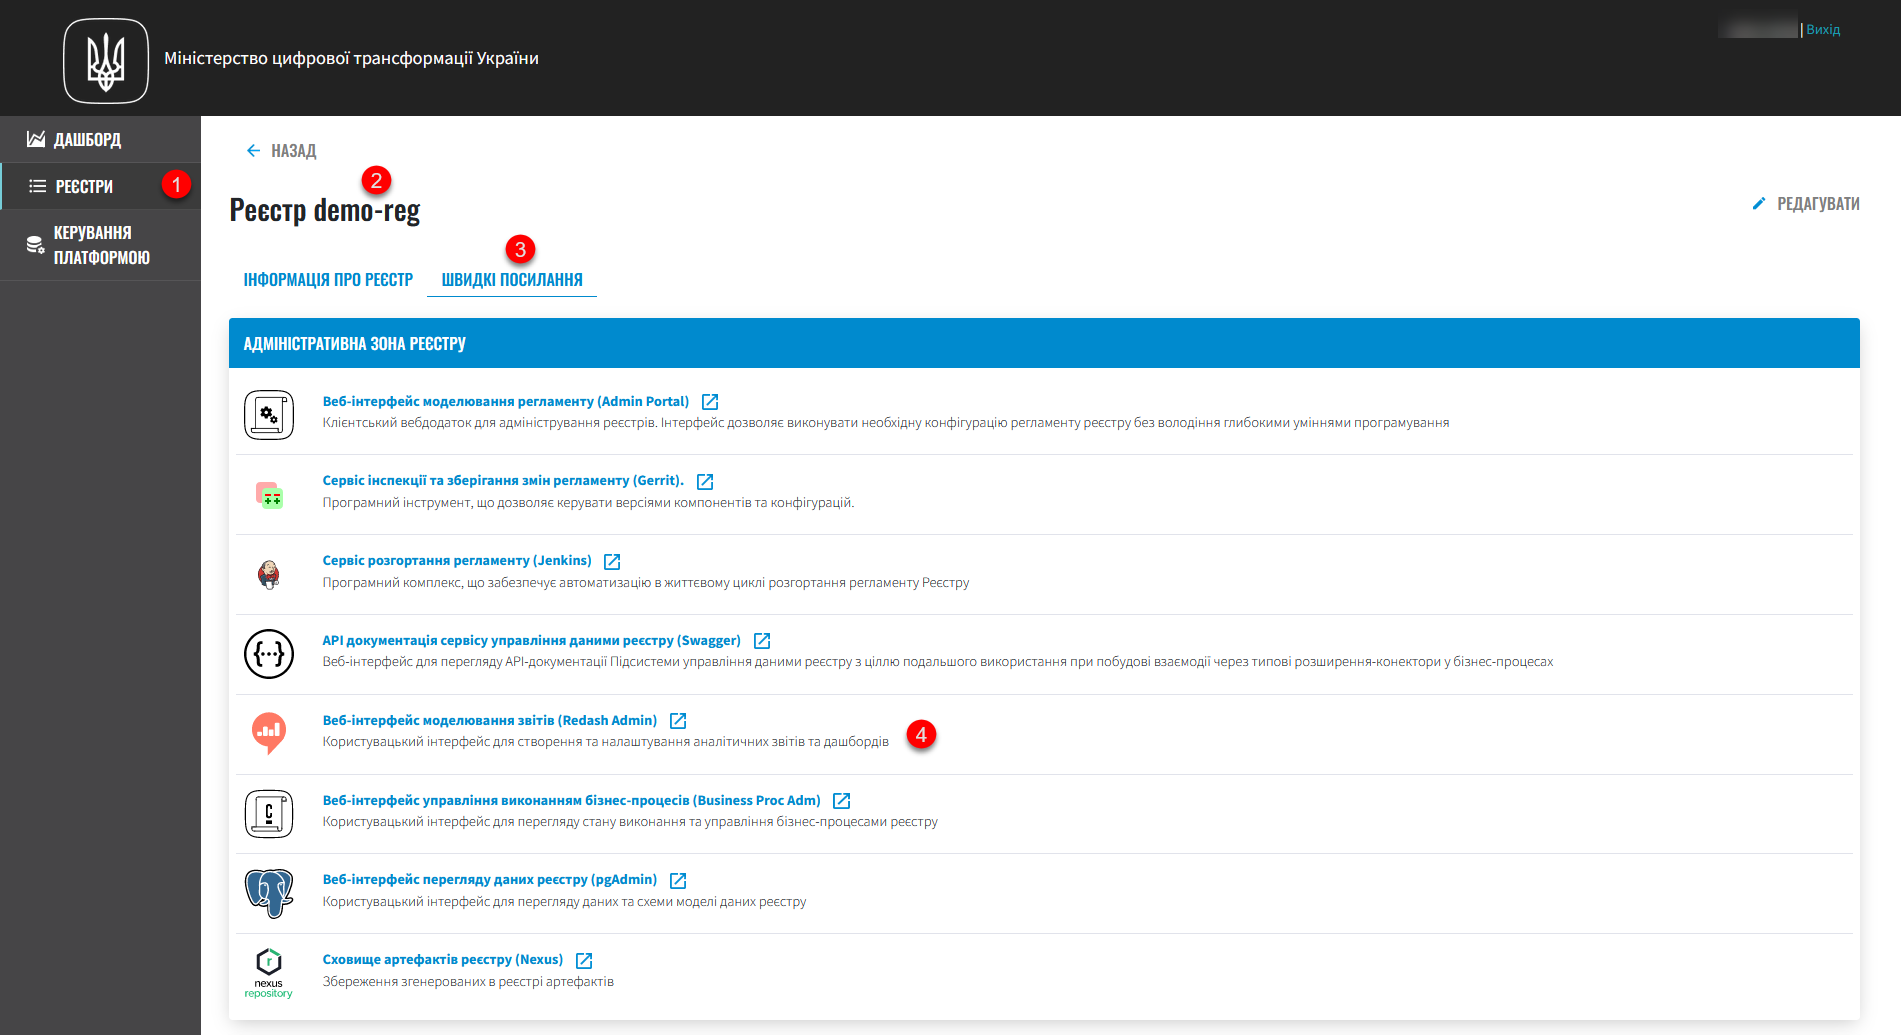
You can access the Reports modeling service (Redash Admin) from the Quick links section in the Control Plane admin console. |
2. Multiple instances
Analytical reporting is provided by two instances of Redash, which build a reporting system based on a replica of the registry’s operational database.
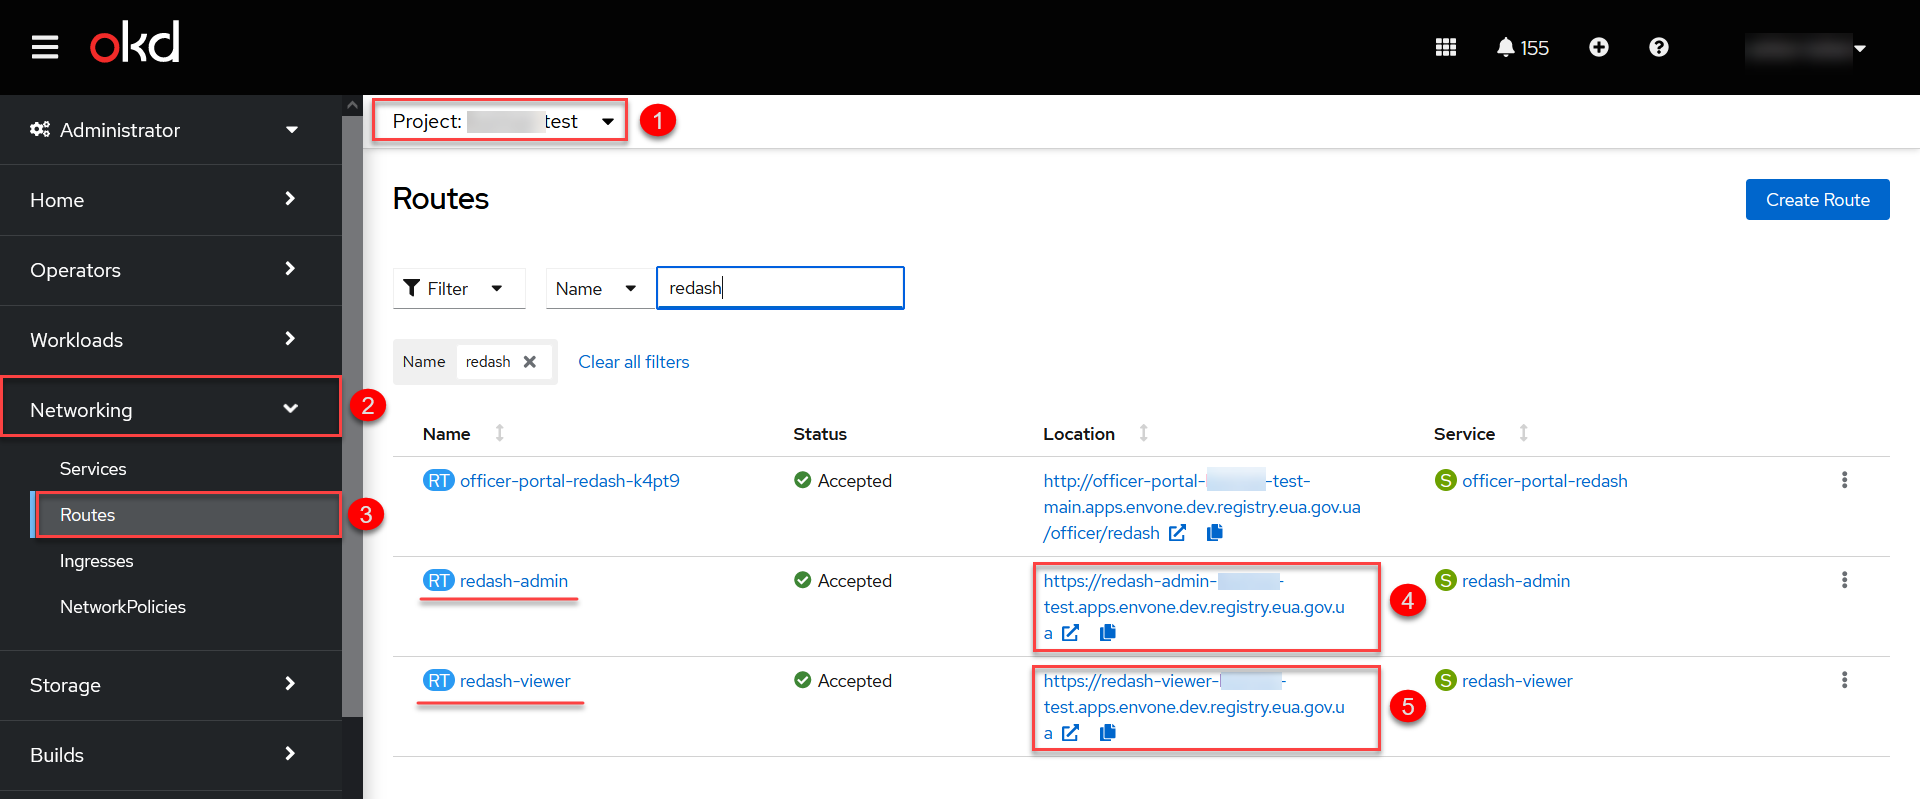
One instance, redash-admin, is intended for reports administration, development, and publishing. For security reasons, it is separated from the other instance, redash-viewer, which contains the content published for user needs.
Access to the content of Redash servers is segmented based on the user’s group membership, which is, in turn, associated with a data source.
Segmentation of data access is based on the database users associated with the corresponding data source to execute queries against the database replica.
3. Creating an analytical layer at the data model level
The Redash analytical reporting system has access only to database replicas and only to analytical views. To create these views, use the <ext:createAnalyticsView> tag, similar to the tag for creating search conditions.
|
For details on creating search conditions and analytical views, and providing access to analytical views at the data model level, see: |
4. Creating reports in the Redash web interface
Analytical reporting is based on the admin instance of Redash. You must have the redash-admin role in the registry’s -admin realm. The role is assigned by the security administrator in the Keycloak service interface. For details on managing users and roles, see Creating users in the system.
Additional information on the redash-admin and redash-viewer instances
|
