Aggregate Application Logs Using EFK Stack⚓︎
This documentation describes the advantages of EFK stack over the traditional ELK stack, explains the value that this stack brings to EDP and instructs how to set up the EFK stack to integrate the advanced logging system with your application.
ELK Stack Overview⚓︎
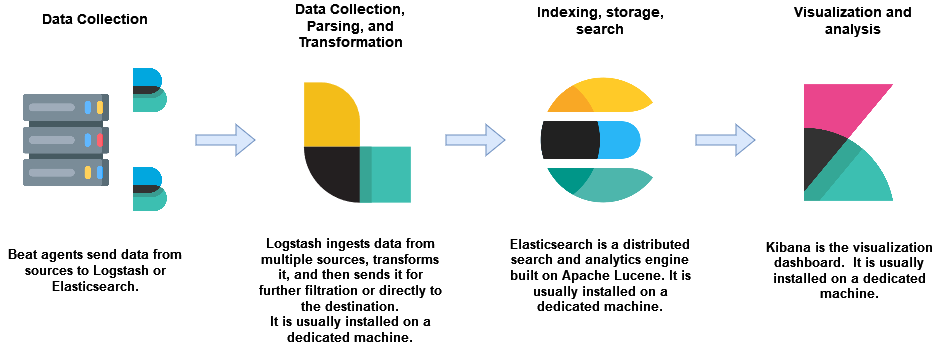
The ELK (Elasticsearch, Logstash and Kibana) stack gives the ability to aggregate logs from all the managed systems and applications, analyze these logs and create visualizations for application and infrastructure monitoring, faster troubleshooting, security analytics and more.
Here is a brief description of the ELK stack default components:
- Beats family - The logs shipping tool that conveys logs from the source locations, such as Filebeat, Metricbeat, Packetbeat, etc. Beats can work instead of Logstash or along with it.
- Logstash - The log processing framework for log collecting, processing, storing and searching activities.
- Elasticsearch - The distributed search and analytics engine based on Lucene Java library.
- Kibana - The visualization engine that queries the data from Elasticsearch.
EFK Stack Overview⚓︎
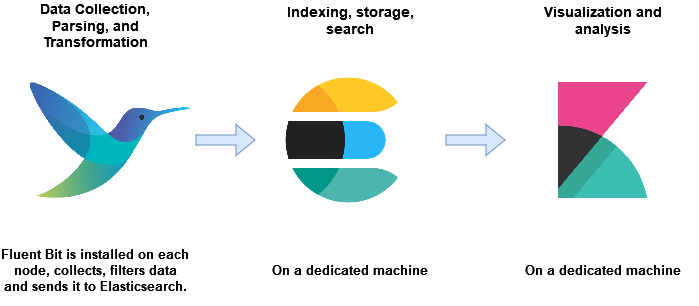
We use FEK (also called EFK) (Fluent Bit, Elasticsearch, Kibana) stack in Kubernetes instead of ELK because this stack provides us with the support for Logsight for Stage Verification and Incident Detection. In addition to it, Fluent Bit has a smaller memory fingerprint than Logstash. Fluent Bit has the Inputs, Parsers, Filters and Outputs plugins similarly to Logstash.
Automate Elasticsearch Index Rollover With ILM⚓︎
In this guide, index rollover with the Index Lifecycle Management ILM is automated in the FEK stack.
The resources can be created via API using curl, Postman, Kibana Dev Tools console or via GUI. They are going to be created them using Kibana Dev Tools.
-
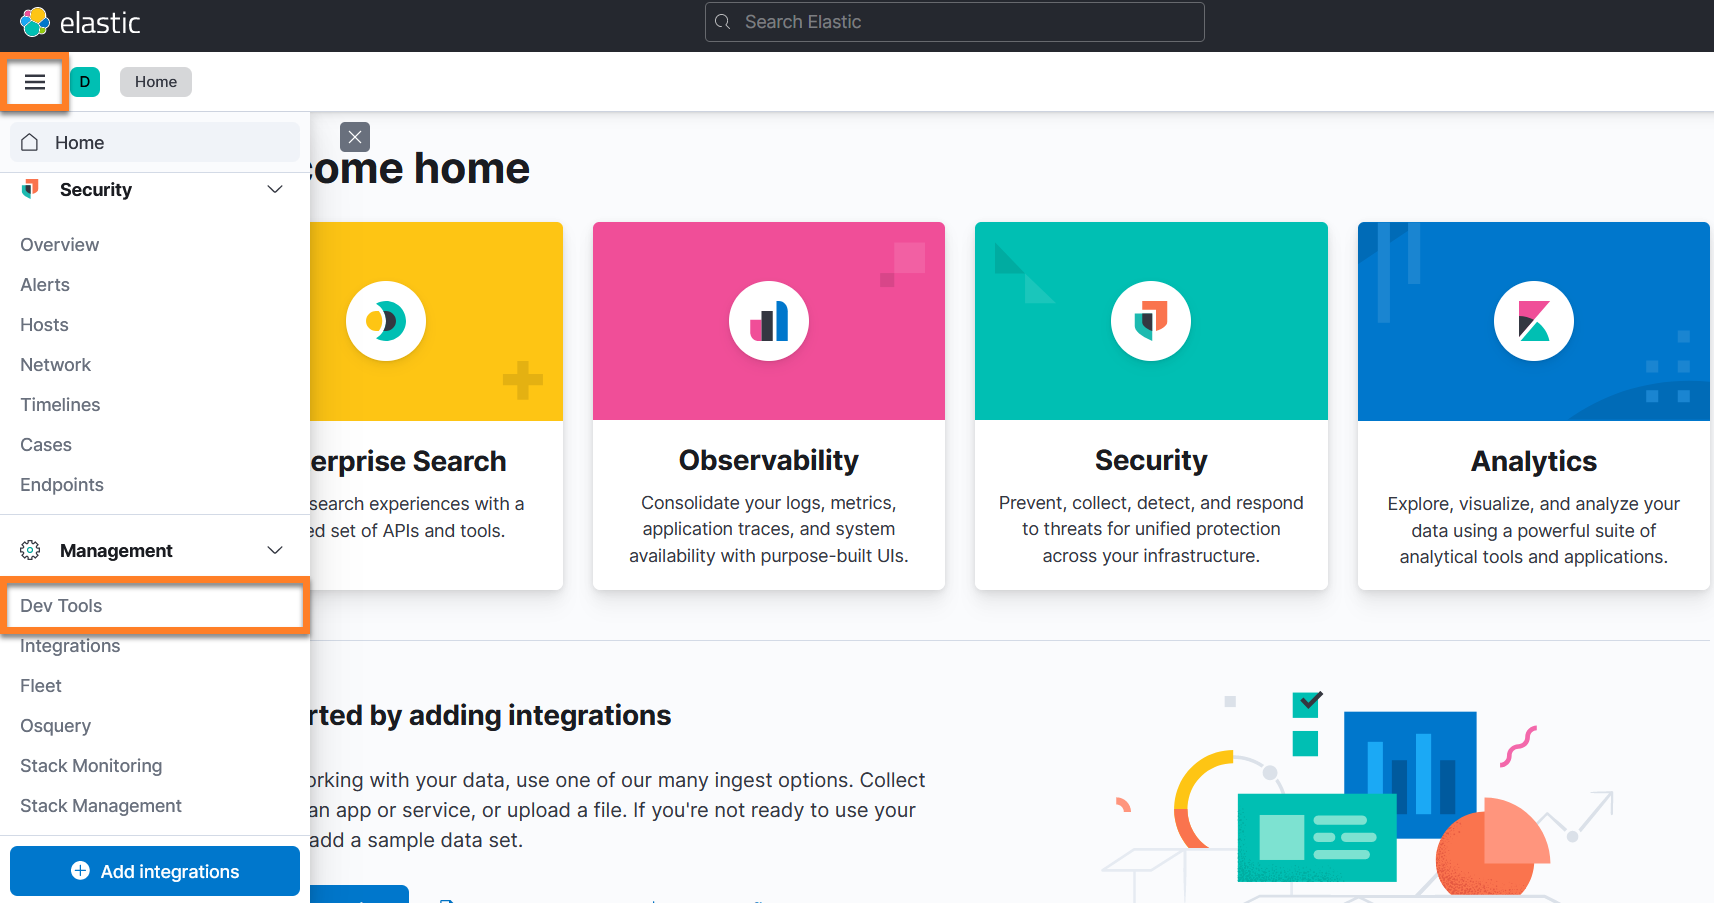
Go to
Management→Dev Toolsin the Kibana dashboard: -
Create index lifecycle policy with the index rollover:
Note
This policy can also be created in GUI in
Management→Stack Management→Index Lifecycle Policies.Index Lifecycle has several phases: Hot, Warm, Cold, Frozen, Delete. Indices also have different priorities in each phase. The warmer the phase, the higher the priority is supposed to be, e.g., 100 for the hot phase, 50 for the warm phase, and 0 for the cold phase.
In this Use Case, only the Hot and Delete phases are configured. So an index will be created, rolled over to a new index when 1gb in size or 1day in time and deleted in 7 days. The rollover may not happen exactly at 1GB because it depends on how often Kibana checks the index size. Kibana usually checks the index size every 10 minutes but this can be changed by setting the indices.lifecycle.poll_interval monitoring timer.
The index lifecycle policy example:
Index Lifecycle Policy
PUT _ilm/policy/fluent-bit-policy
{
  "policy": {
    "phases": {
      "hot": {
        "min_age": "0ms",
        "actions": {
          "set_priority": {
            "priority": 100
          },
          "rollover": {
            "max_size": "1gb",
            "max_primary_shard_size": "1gb",
            "max_age": "1d"
          }
        }
      },
      "delete": {
        "min_age": "7d",
        "actions": {
          "delete": {
            "delete_searchable_snapshot": true
          }
        }
      }
    }
  }
}
Insert the code above into the
Dev Toolsand click the arrow to send thePUTrequest. -
Create an index template so that a new index is created according to this template after the rollover:
Note
This policy can also be created in GUI in
Management→Stack Management→Index Management→Index Templates.Expand the menu below to see the index template example:
Index Template
Note
index.lifecycle.rollover_aliasis required when using a policy containing the rollover action and specifies which alias to rollover on behalf of this index. The intention here is that the rollover alias is also defined on the index.
number_of_shardsis the quantity of the primary shards. Elasticsearch index is really just a logical grouping of one or more physical shards, where each shard is actually a self-contained index. By distributing the documents in an index across multiple shards and distributing those shards across multiple nodes, Elasticsearch can ensure redundancy, which both protects against hardware failures and increases query capacity as nodes are added to a cluster. As the cluster grows (or shrinks), Elasticsearch automatically migrates shards to re-balance the cluster. Please refer to the official documentation here.
-
number_of_replicasis the number of replica shards. A replica shard is a copy of a primary shard. Elasticsearch will never assign a replica to the same node as the primary shard, so make sure you have more than one node in your Elasticsearch cluster if you need to use replica shards. The Elasticsearch cluster details and the quantity of nodes can be checked with:
Since we use one node, the number_of_shards is 1 and number_of_replicas is 0. If you put more replicas within one node, your index will get yellow status in Kibana, yet still be working.
-
Create an empty index with write permissions:
Note
This index can also be created in GUI in
Management→Stack Management→Index Management→Indices.Index example with the date math format:
Index
The code above will create an index in the
{index_name}-{current_date}-{rollover_index_increment}format. For example:fluent-bit-kube-2023.03.17-000001.Please refer to the official documentation on the index rollover with Date Math here.
Note
It is also possible to use index pattern below if the date math format does not seem applicable:
Check the status of the created index:
-
Configure Fluent Bit. Play attention to the Elasticsearch Output plugin configuration.
The important fields in the
[OUTPUT]section areIndex fluent-bit-kubesince we should use the index with the same name as Rollover Alias in Kibana andLogstash_Format Offas we use the Rollover index pattern in Kibana that increments by 1.ConfigMap example with Configuration Variables for
HTTP_UserandHTTP_Passwd:ConfigMap fluent-bit
data: fluent-bit.conf: | [SERVICE] Daemon Off Flush 10 Log_Level info Parsers_File parsers.conf Parsers_File custom_parsers.conf HTTP_Server On HTTP_Listen 0.0.0.0 HTTP_Port 2020 Health_Check On [INPUT] Name tail Tag kube.* Path /var/log/containers/*.log Parser docker Mem_Buf_Limit 5MB Skip_Long_Lines Off Refresh_Interval 10 [INPUT] Name systemd Tag host.* Systemd_Filter _SYSTEMD_UNIT=kubelet.service Read_From_Tail On Strip_Underscores On [FILTER] Name kubernetes Match kube.* Kube_Tag_Prefix kube.var.log.containers. Kube_URL https://kubernetes.default.svc:443 Kube_CA_File /var/run/secrets/kubernetes.io/serviceaccount/ca.crt Kube_Token_File /var/run/secrets/kubernetes.io/serviceaccount/token Merge_Log Off Merge_Log_Key log_processed K8S-Logging.Parser On K8S-Logging.Exclude On [FILTER] Name nest Match kube.* Operation lift Nested_under kubernetes Add_prefix kubernetes. [FILTER] Name modify Match kube.* Copy kubernetes.container_name tags.container Copy log message Copy kubernetes.container_image tags.image Copy kubernetes.namespace_name tags.namespace [FILTER] Name nest Match kube.* Operation nest Wildcard tags.* Nested_under tags Remove_prefix tags. [OUTPUT] Name es Match kube.* Index fluent-bit-kube Host elasticsearch-master Port 9200 HTTP_User ${ES_USER} HTTP_Passwd ${ES_PASSWORD} Logstash_Format Off Time_Key @timestamp Type flb_type Replace_Dots On Retry_Limit False Trace_Error Off -
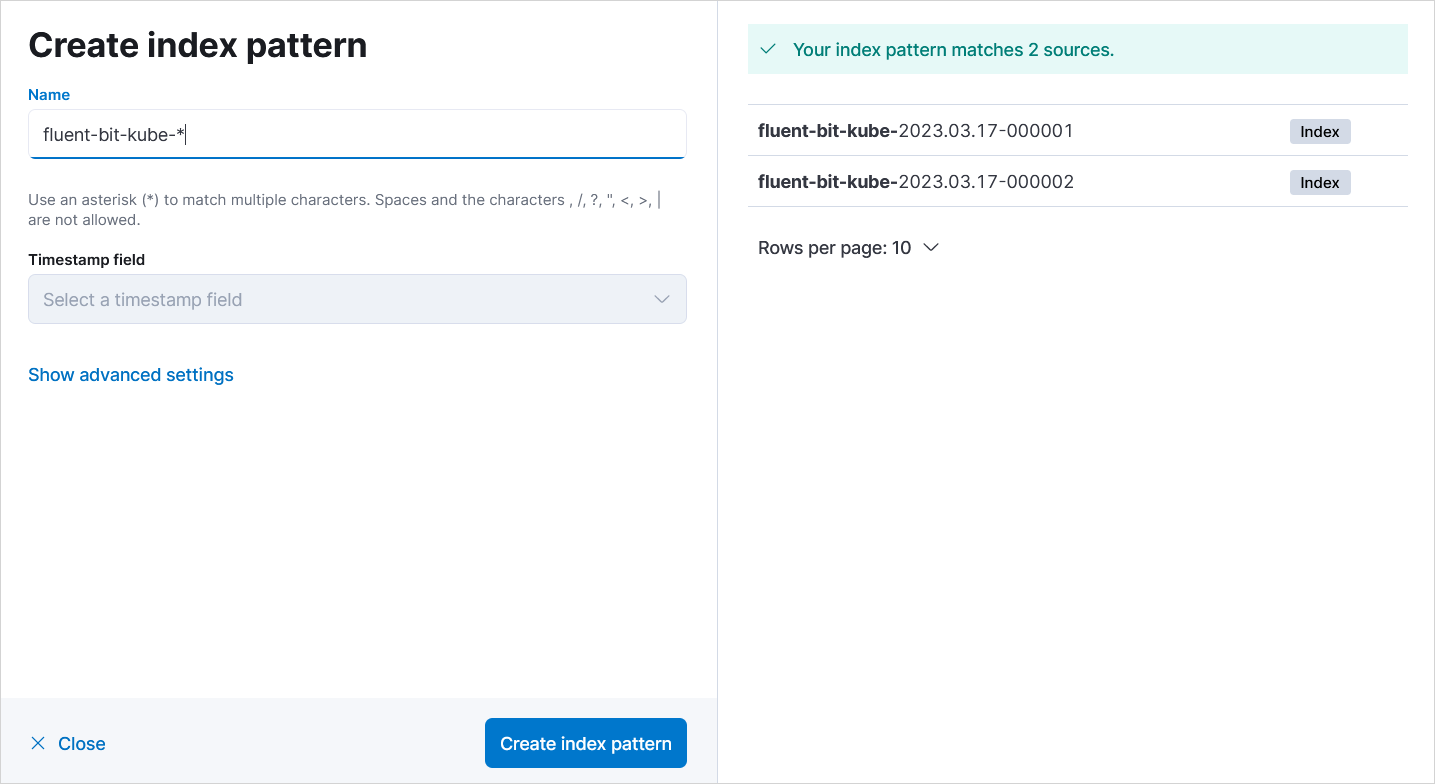
Create index pattern (Data View starting from Kibana v8.0):
Go to
Management→Stack Management→Kibana→Index patternsand create an index with thefluent-bit-kube-*pattern: -
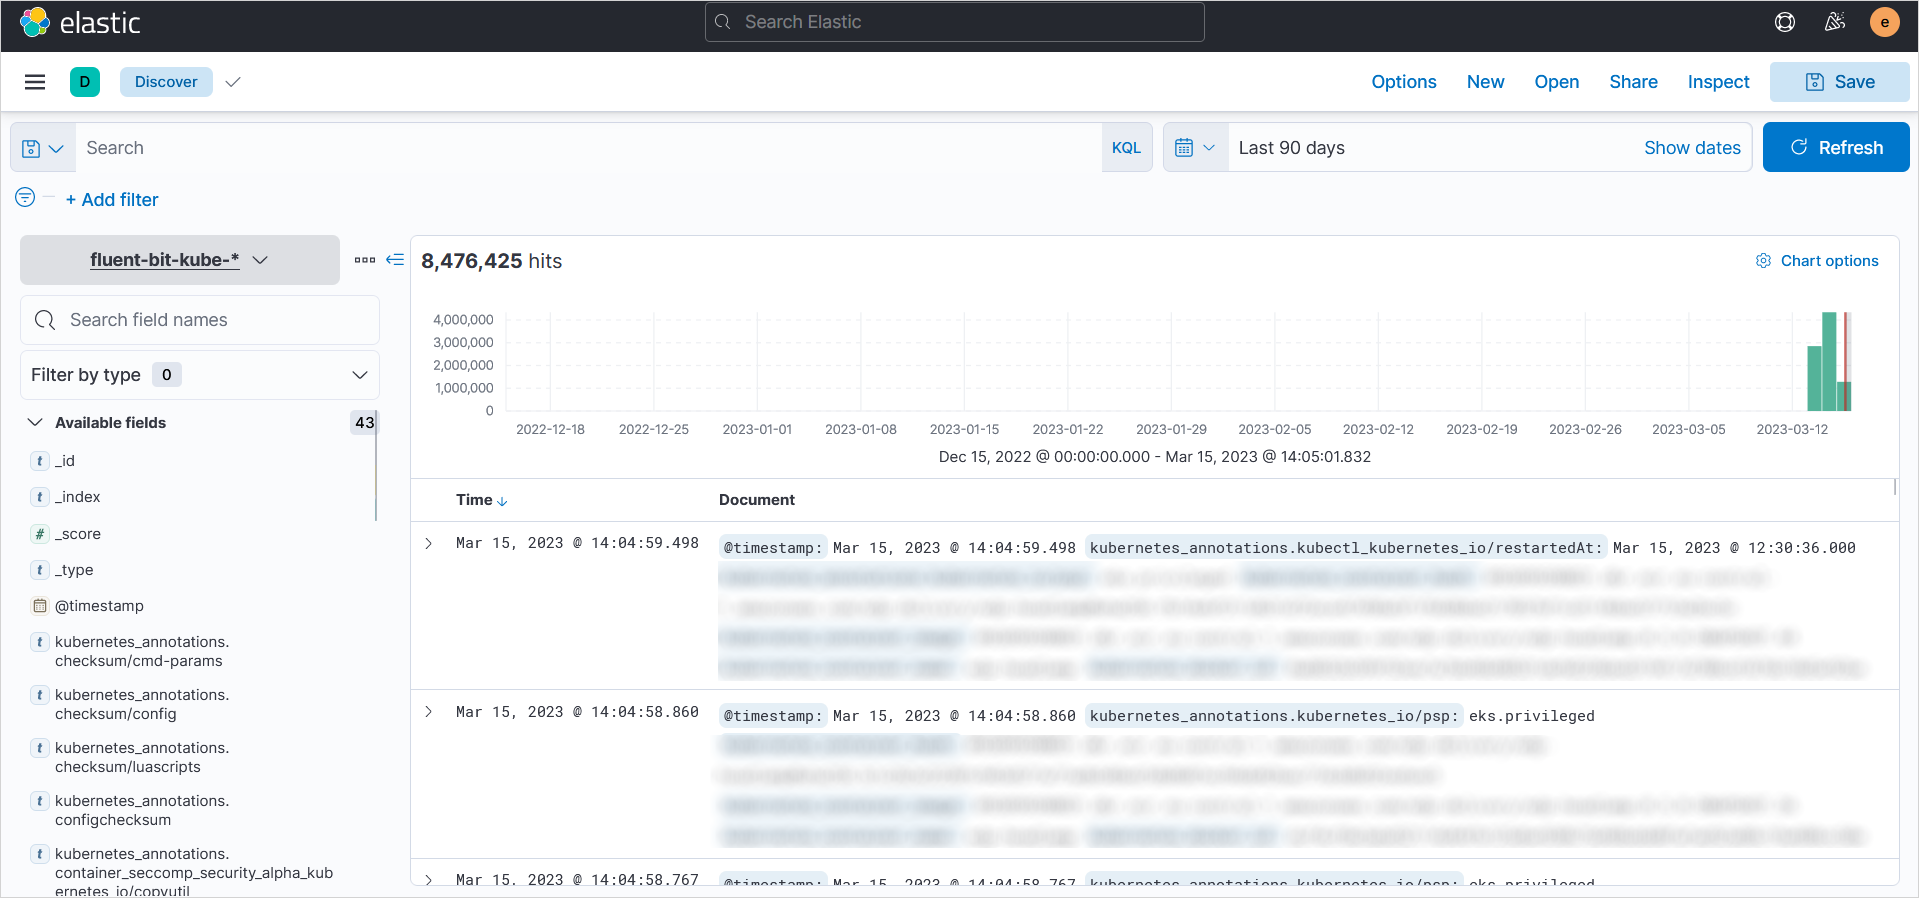
Check logs in Kibana. Navigate to
Analytics→Discover:Note
In addition, in the top-right corner of the
Discoverwindow, there is a button calledInspect. Clicking on it will reveal the query that Kibana is sending to Elasticsearch. These queries can be used in Dev Tools. -
Monitor the created indices:
Note
Physically, the indices are located on the
elasticsearchKubernetes pod in/usr/share/elasticsearch/data/nodes/0/indices. It is recommended to backup indices only via Snapshots.
We've configured the index rollover process. Now the index will be rolled over to a new one once it reaches the indicated size or time in the policy, and old indices will be removed according to the policy as well.
When you create an empty index that corresponds to the pattern indicated in the index template, the index template attaches rollover_alias with the fluent-bit-kube name, policy and other configured data. Then the Fluent Bit Elasticsearch output plugin sends logs to the Index fluent-bit-kube rollover alias. The index rollover process is managed by ILM that increments our indices united by the rollover_alias and distributes the log data to the latest index.
ILM Without Rollover Policy⚓︎
It is also possible to manage index lifecycle without rollover indicated in the policy. If this is the case, this section will explain how to refactor the index to make it look that way: fluent-bit-kube-2023.03.18.
Note
The main drawback of this method is that the indices can be managed only by their creation date.
To manage index lifecycle without rollover policy, follow the steps below:
-
Create a Policy without
rolloverbut with indices deletion: -
Create an index template with the
rollover_aliasparameter: -
Change the Fluent Bit
[OUTPUT]config to this one: -
Restart Fluent Bit pods.
Fluent Bit will be producing a new index every day with the new date in its name like in the fluent-bit-kube-2023.03.18 name. Index deleting will be performed according to the policy.
Tips on Fluent Bit Debugging⚓︎
If you experience a lot of difficulties when dealing with Fluent Bit, this section may help you.
Fluent Bit has docker images labelled -debug, e.g., cr.fluentbit.io/fluent/fluent-bit:2.0.9-debug.
Change that image in the Kubernetes Fluent Bit DaemonSet and add the Trace_Error On parameter to the [OUTPUT] section in the Fluent Bit configmap:
After adding the parameter above, you will start seeing more informative logs that will probably help you find out the reason of the problem.
