NGB
Working with Annotations
Viewing variation results
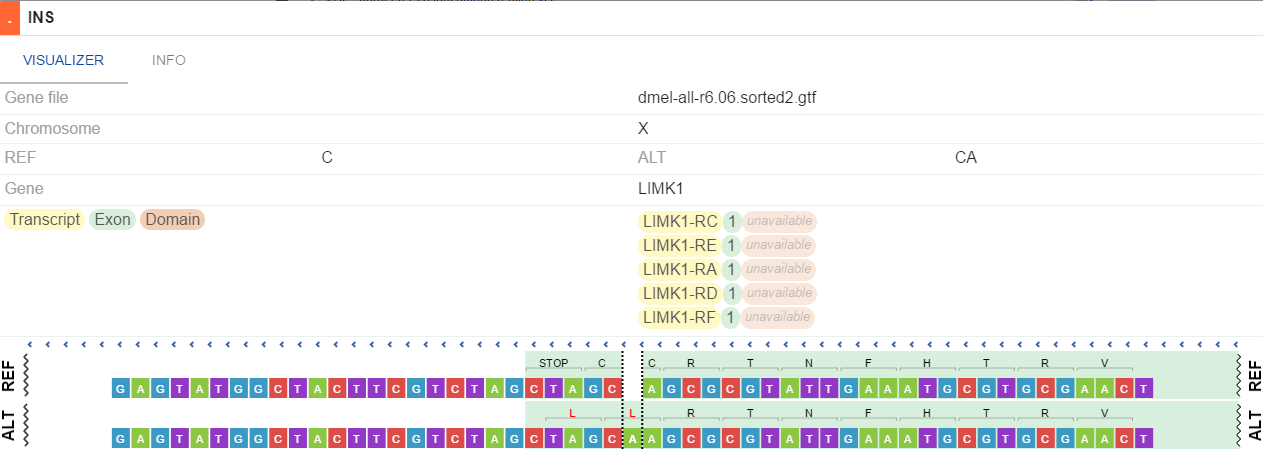
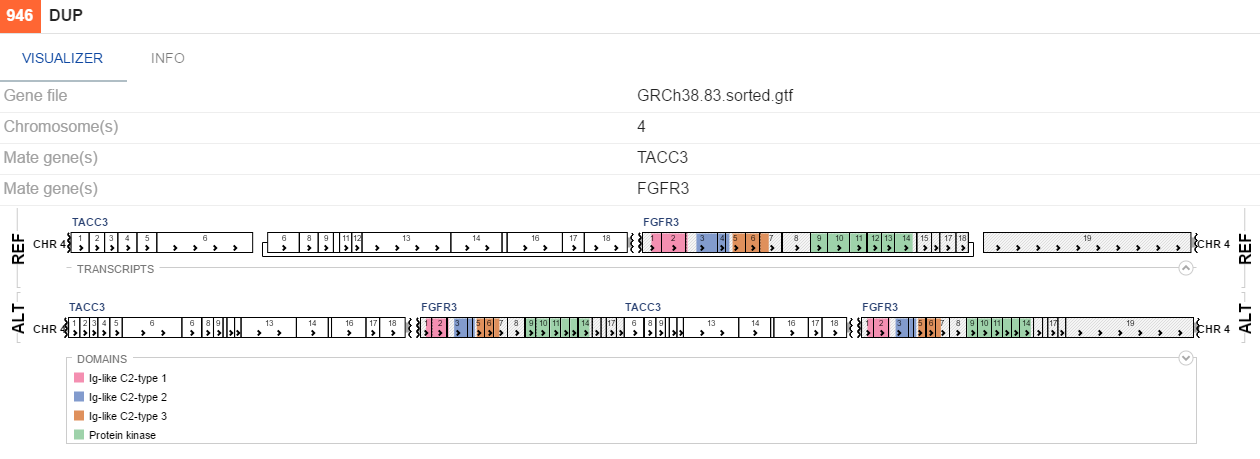
When you click on a variation, a popup with the results of a DNA rearrangement appears. There are two types of visualization:
- SNP and small indels - shows variations on an exons-introns structure, aminoacids on REF/ALT sequences
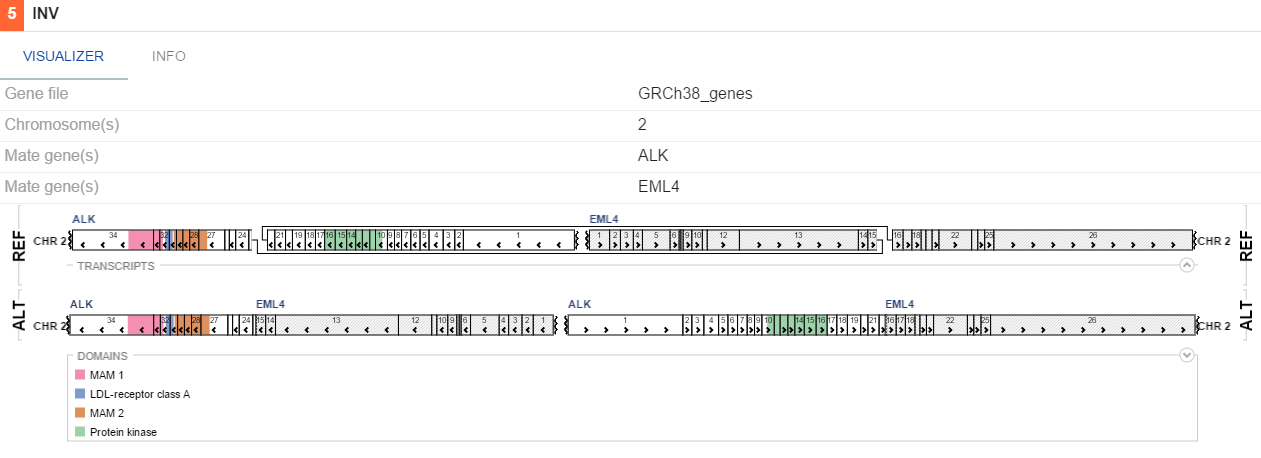
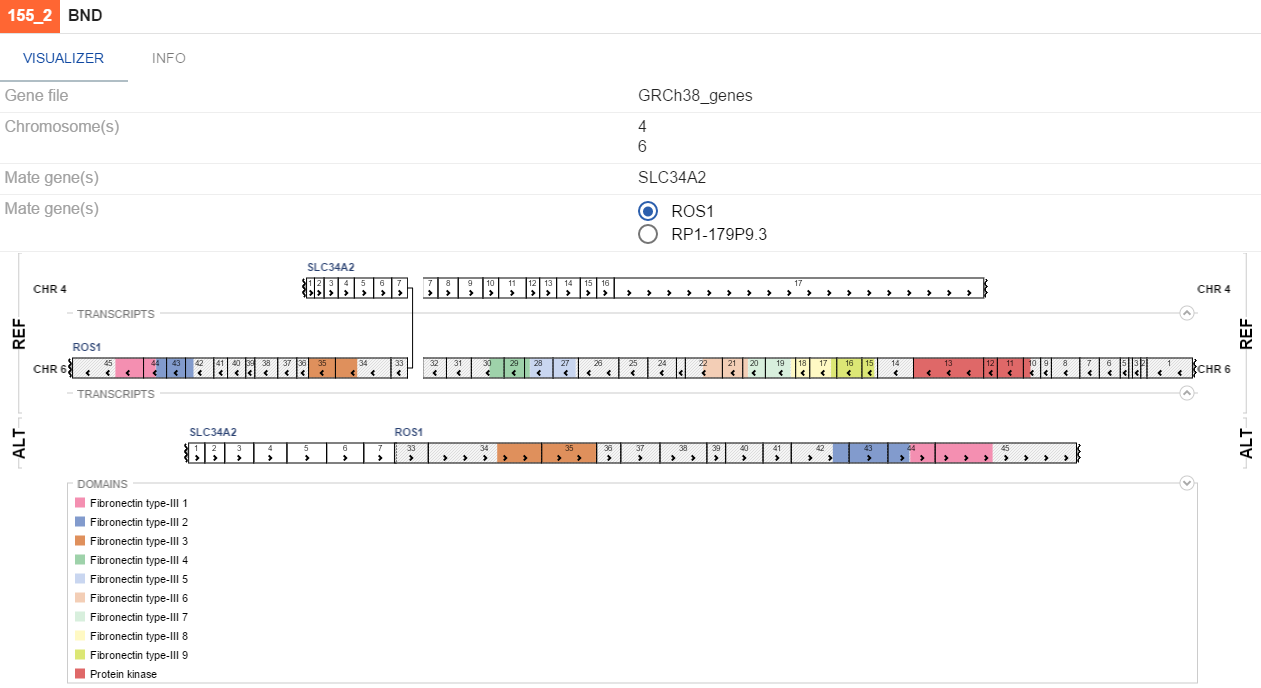
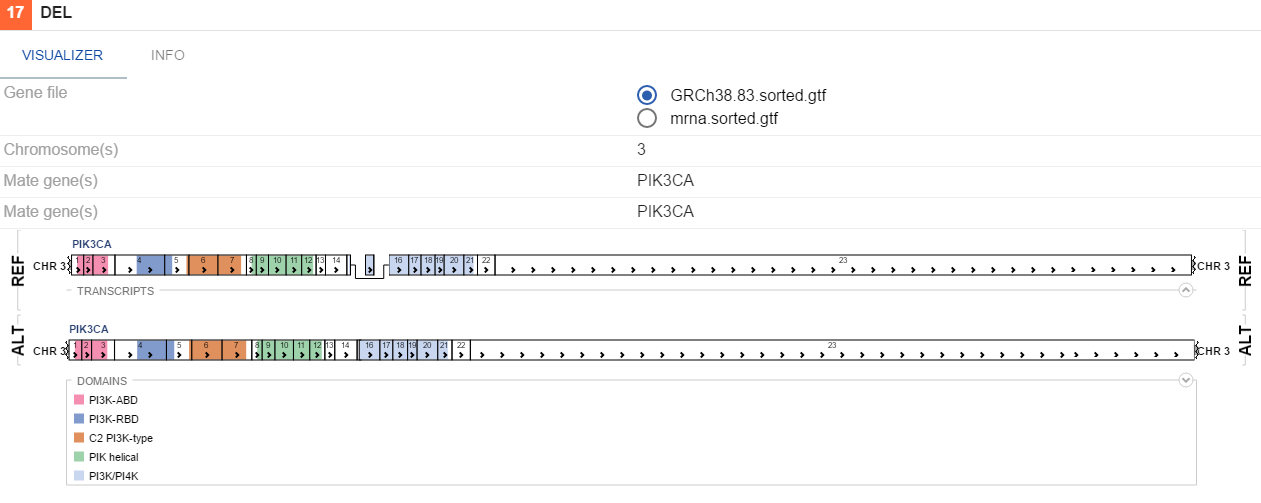
- Structural variations - shows large chromosome rearangements. A specific visualization is used for each SV type.
-
INV
-
BND
-
DEL
-
DUP
-
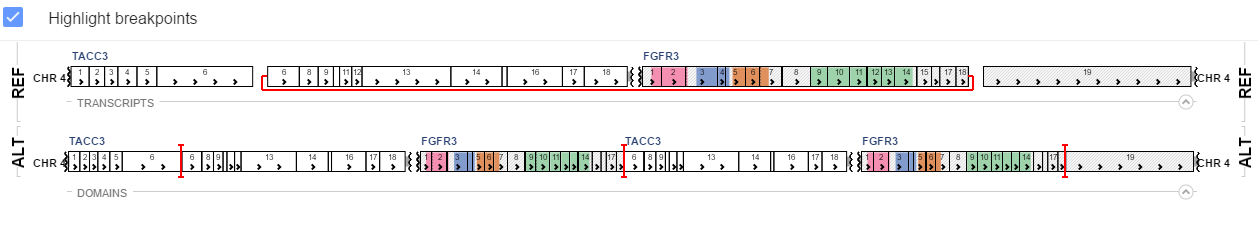
If uniprot contains information on protein domains for a gene involved in a variation, these will be visualized as colors on genes. By default, breakpoints of an SV would be highlighted with a red line, indicating the places where the genes fused. To toggle this functionality, (un)tick the Highlight breakpoints checkbox on the VISUALIZER tab.
Retrieving protein 3D structures
As described in the Molecular viewer section, the NGB allows to view the 3D structure of a protein. To enable this, external databases are used:
- A call to Ensembl is performed to retrieve a list of transcripts of a gene and the link to uniprot entry for each transcript
- A list of corresponding PDB IDs with the current chain in a PDB is retrieved from the uniprot entry
- Finally, a PDB file is retrieved from RCSB and visualized.